Licensed Practical Nurse Salary in Norwich, CT: $79,920 (2026)
Quick Answer:A full-time licensed practical nurse in Norwich, CT earns a median $79,920/year (≈ $38.42/hour) in nominal terms for 2026 — projected from BLS OEWS 2025 (SOC 29-2061). Once you factor in Norwich's price level (0% above national, BEA RPP 100.4), that paycheck buys what $79,566 would nationally. Nominal pay sits 2.4% above the Connecticut state average.
Official BLS data · View source
Licensed practical nurse salaries in Norwich, Connecticut, are particularly competitive, reflecting the city's evolving healthcare landscape. In 2026, the median annual salary for licensed practical nurses is projected to be $79,920, which is notably higher than the national median of $68,071, representing a substantial premium. The pay scale ranges from $64,604 at the lower end to $88,492 for those at the highest level. Data derived from 2025 BLS OEWS surveys indicate that various employment settings significantly influence compensation, with skilled nursing facilities often offering higher wages compared to home health agencies and outpatient clinics. This disparity in pay underscores the variety of career pathways available for LPNs in Norwich, where the job market remains robust.
Salary Breakdown
| Percentile | Annual | Hourly |
|---|---|---|
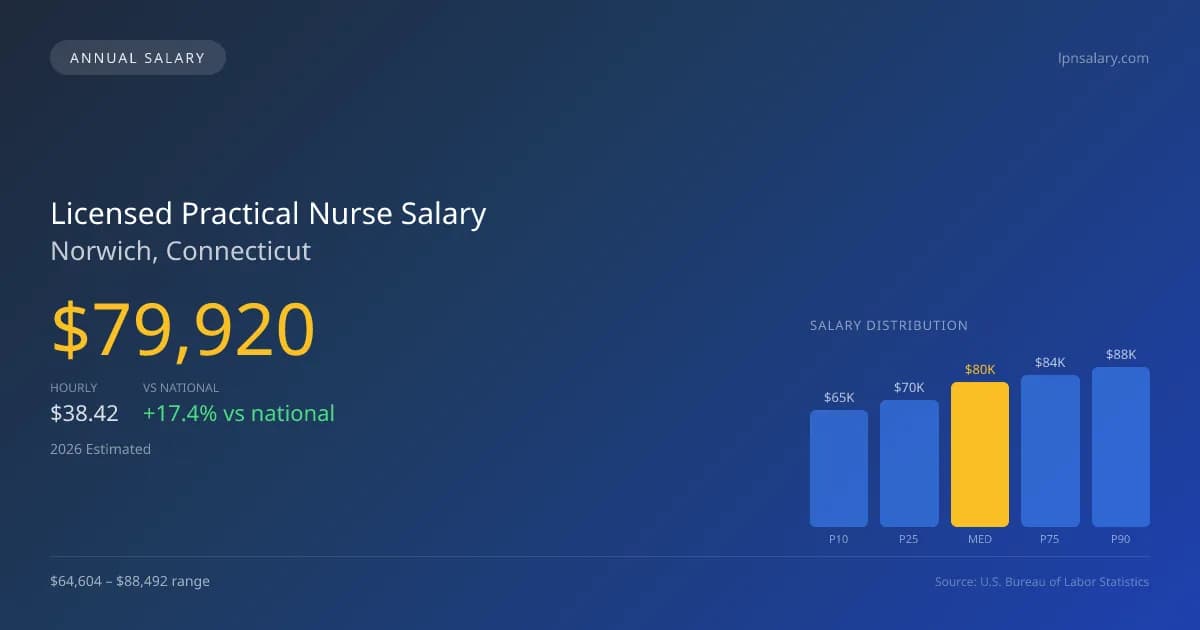
| Entry Level (P10) | $64,604 | $31.07 |
| Lower Range (P25) | $70,460 | $33.88 |
| Median (P50)(typical) | $79,920 | $38.42 |
| Upper Range (P75) | $83,862 | $40.31 |
| Top Earners (P90) | $88,492 | $42.54 |
Median Salary Position
17.41% above the national average
2026 Salary Percentile Distribution in Norwich
In Norwich, CT, the licensed practical nurse salary spread from the 10th to 90th percentile is $23,888 (2026 est.). At $79,920, the local median is 17.41% above the national median of $68,071.
Salary Calculator
At 40 hours/week in Norwich: You'd be above the median
How Norwich Licensed Practical Nurse Pay Compares
Norwich median: $79,920/year (2026)
| Compared To | Median Salary | Norwich Pays |
|---|---|---|
| Connecticut Average | $78,047 | +2.40% more |
| National Average | $68,071 | +17.41% more |
Licensed Practical Nurses in Norwich, CT earn a median of $79,920 per year (2026 est.), which is 17.41% higher than the national median of $68,071 and 2.40% above the Connecticut state average of $78,047.
Cost-of-Living Adjusted Salary
Norwich has a cost of living 0.44% above the national average.
Adjusted salary = nominal × (100 / CoL index). CoL index: 100 = national average.
Norwich, CT has a cost-of-living index of 100.445 (above the national average of 100). While the nominal salary of $79,920 is competitive, the higher cost of living reduces purchasing power to an effective $79,566 — a 0.44% reduction.
Compare Purchasing Power
Select a city to see how your salary compares after cost of living
Select a city above to compare purchasing power
2019 BLS Actual
$57,050
2025 BLS Actual
$75,610
2026 Current Est.
$79,920
2019–2027 Growth
+48.1%
Salary Trajectory for Licensed Practical Nurses in Norwich (2019–2027)
2019–2025: actual BLS OEWS data for this metro area. 2026+: CAGR 5.70% projection.
| Year | Annual Salary | Status |
|---|---|---|
| 2019 | $57,050 | Actual |
| 2020 | $56,970 | Actual |
| 2021 | $59,260 | Actual |
| 2022 | $60,630 | Actual |
| 2023 | $63,570 | Actual |
| 2024 | $68,660 | Actual |
| 2025 | $75,610 | Actual |
| 2026(current) | $79,920 | Estimated |
| 2027 | $84,475 | Projected |
Based on 7 years of BLS OEWS data for the Norwich metropolitan area, the median licensed practical nurse salary grew 32.5% from $57,050 (2019) to $75,610 (2025). At a 5.70% compound annual growth rate, salaries are projected to reach $84,475 by 2027 — a total increase of $27,425 (48.07%) from 2019.
Note: Historical values (2019–2025) are actual BLS OEWS figures for the Norwich metropolitan area, sourced from annual Occupational Employment and Wage Statistics surveys. 2026–2026 figures are current estimates, and 2027 values are projections, calculated using a 5.70% CAGR derived from 7-year BLS historical data. Actual salaries may vary based on employer, experience, certifications, and local market conditions.
Salary by Experience Level
| Experience | Estimated Salary Range |
|---|---|
| 0-2 years (New Graduate) | $64,604 – $70,460 |
| 3-5 years (Mid Career) | $70,460 – $79,920 |
| 5+ years (Experienced) | $79,920 – $83,862 |
| 10+ years (Top Earner) | $83,862 – $88,492 |
LPN salary ranges estimated from BLS percentile data. Individual licensed practical nurse compensation varies by employer, certifications, and specialization.
Licensed Practical Nurse Job Market in Norwich
In Norwich, there are currently about 590 licensed practical nurses employed, highlighting a thriving local job market. The cost of living index stands at 100.445, marginally above the national average, which can influence take-home pay and purchasing power for LPNs. Among local employers, skilled nursing facilities tend to pay the most, followed by hospitals and home health agencies. Several factors create a significant pay variance: the setting of employment where skilled nursing roles generally command higher salaries, as well as additional compensation for shifts, IV therapy certification, and weekend or holiday work premiums. To maximize earnings in Norwich, LPNs might consider obtaining specialized certifications or focusing on advanced practice areas, as such qualifications can elevate pay within both long-term care and acute healthcare settings in CT.
More salary data for Norwich, CT:
Frequently Asked Questions
How much do licensed practical nurses make in Norwich, CT in 2026?
Is Norwich, CT a good place to work as a licensed practical nurse?
Can licensed practical nurses make $100K in Norwich?
What is the cost-of-living adjusted licensed practical nurse salary in Norwich?
How much does a licensed practical nurse make per hour in Norwich?
Related Pages
Compare Salaries
Career Resources
Nearby Cities in Connecticut
Written by Aisha Malik, LPN
Career Analyst
Aisha has 10 years of experience as a licensed practical nurse. She specializes in pediatric nursing. Aisha has worked in various outpatient clinics.
Methodology & Data Source
Salary figures on this page are 2026 projections based on the Bureau of Labor Statistics Occupational Employment and Wage Statistics (OEWS) survey, May 2026 release. The BLS reported a median annual salary of $75,610 for licensed practical nursesin the Norwich metropolitan area. A 5.70% compound annual growth rate (CAGR), calculated from 6-year national BLS wage trends, was applied to project current 2026 compensation. Percentile ranges (P10–P90) represent the full salary distribution across experience levels and practice settings in this market.
Data Sources & Methodology
Source: BLS, OEWS, 7-year dataset (–). Per-city data from annual BLS metropolitan area surveys.
2026 figures are projected from 2025 BLS data using a compound annual growth rate (CAGR) of 5.70%, derived from historical BLS wage trends for licensed practical nurses (SOC 29-2061).
Compiled and verified by Aisha Malik, LPN, a licensed licensed practical nurse with 10+ years of clinical experience. · View source data at BLS.gov