Licensed Practical Nurse Salary in Cape Coral, FL: $65,037 (2026)
Quick Answer:A full-time licensed practical nurse in Cape Coral, FL earns a median $65,037/year (≈ $31.27/hour) in nominal terms for 2026 — projected from BLS OEWS 2025 (SOC 29-2061). Once you factor in Cape Coral's price level (2% above national, BEA RPP 102.3), that paycheck buys what $63,544 would nationally. Nominal pay sits 1.3% above the Florida state average.
Official BLS data · View source
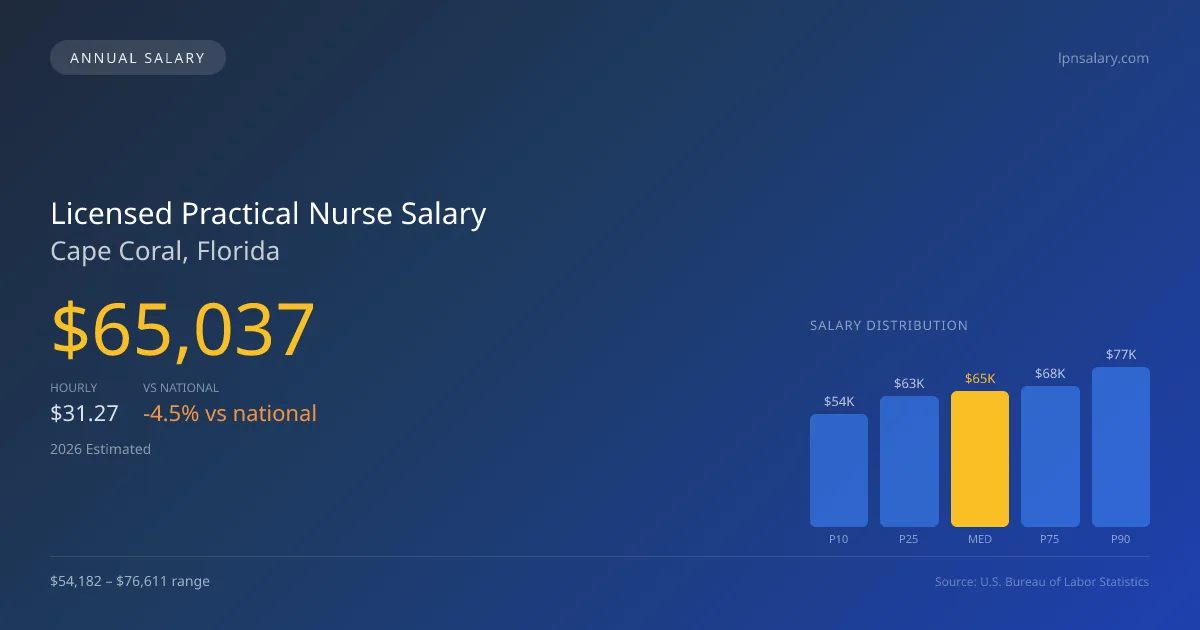
With a projected median annual salary of $65,037 in 2026, licensed practical nurse salaries in Cape Coral, FL, highlight the city’s growing demand for skilled practitioners in various healthcare settings. The salary range spans from $54,182 at the 10th percentile to $76,611 at the 90th percentile, reflecting the differences in responsibilities and work environments. Nurses in skilled nursing facilities, home health, and clinics often see variations in compensation tied to their specific roles and shift differentials. This data, derived from official Bureau of Labor Statistics (BLS) surveys, indicates a competitive job market, further encouraged by a notable growth rate of 5.70%, as the region prepares for increasing healthcare needs.
Salary Breakdown
| Percentile | Annual | Hourly |
|---|---|---|
| Entry Level (P10) | $54,182 | $26.06 |
| Lower Range (P25) | $62,744 | $30.17 |
| Median (P50)(typical) | $65,037 | $31.27 |
| Upper Range (P75) | $67,511 | $32.46 |
| Top Earners (P90) | $76,611 | $36.84 |
Median Salary Position
4.46% below the national average
2026 Salary Percentile Distribution in Cape Coral
In Cape Coral, FL, the licensed practical nurse salary spread from the 10th to 90th percentile is $22,429 (2026 est.). At $65,037, the local median is 4.46% below the national median of $68,071.
Salary Calculator
At 40 hours/week in Cape Coral: You'd be in the lower-middle range
How Cape Coral Licensed Practical Nurse Pay Compares
Cape Coral median: $65,037/year (2026)
| Compared To | Median Salary | Cape Coral Pays |
|---|---|---|
| Florida Average | $64,203 | +1.30% more |
| National Average | $68,071 | -4.46% less |
Licensed Practical Nurses in Cape Coral, FL earn a median of $65,037 per year (2026 est.), which is 4.46% lower than the national median of $68,071 and 1.30% above the Florida state average of $64,203.
Cost-of-Living Adjusted Salary
Cape Coral has a cost of living 2.35% above the national average.
Adjusted salary = nominal × (100 / CoL index). CoL index: 100 = national average.
Cape Coral, FL has a cost-of-living index of 102.349 (above the national average of 100). While the nominal salary of $65,037 is competitive, the higher cost of living reduces purchasing power to an effective $63,544 — a 2.3% reduction.
Compare Purchasing Power
Select a city to see how your salary compares after cost of living
Select a city above to compare purchasing power
2019 BLS Actual
$44,390
2025 BLS Actual
$61,530
2026 Current Est.
$65,037
2019–2027 Growth
+54.9%
Salary Trajectory for Licensed Practical Nurses in Cape Coral (2019–2027)
2019–2025: actual BLS OEWS data for this metro area. 2026+: CAGR 5.70% projection.
| Year | Annual Salary | Status |
|---|---|---|
| 2019 | $44,390 | Actual |
| 2020 | $45,090 | Actual |
| 2021 | $47,620 | Actual |
| 2022 | $51,070 | Actual |
| 2023 | $58,010 | Actual |
| 2024 | $60,320 | Actual |
| 2025 | $61,530 | Actual |
| 2026(current) | $65,037 | Estimated |
| 2027 | $68,744 | Projected |
Based on 7 years of BLS OEWS data for the Cape Coral metropolitan area, the median licensed practical nurse salary grew 38.6% from $44,390 (2019) to $61,530 (2025). At a 5.70% compound annual growth rate, salaries are projected to reach $68,744 by 2027 — a total increase of $24,354 (54.86%) from 2019.
Note: Historical values (2019–2025) are actual BLS OEWS figures for the Cape Coral metropolitan area, sourced from annual Occupational Employment and Wage Statistics surveys. 2026–2026 figures are current estimates, and 2027 values are projections, calculated using a 5.70% CAGR derived from 7-year BLS historical data. Actual salaries may vary based on employer, experience, certifications, and local market conditions.
Salary by Experience Level
| Experience | Estimated Salary Range |
|---|---|
| 0-2 years (New Graduate) | $54,182 – $62,744 |
| 3-5 years (Mid Career) | $62,744 – $65,037 |
| 5+ years (Experienced) | $65,037 – $67,511 |
| 10+ years (Top Earner) | $67,511 – $76,611 |
LPN salary ranges estimated from BLS percentile data. Individual licensed practical nurse compensation varies by employer, certifications, and specialization.
Licensed Practical Nurse Job Market in Cape Coral
Examining the local job market reveals that Cape Coral employs approximately 1,170 licensed practical nurses, who face a cost-of-living index of 102.349, slightly above the national average. As a result, the purchasing power of these salaries can vary. Facilities such as skilled nursing organizations typically offer the highest compensation, while home health agencies and physician offices may provide lower pay. The spectrum of salaries can be influenced by factors such as the setting, which often sees skilled nursing salaries surpassing those of home health, as well as whether LPNs hold credentials for IV therapy, which may yield additional stipends. For LPNs seeking to maximize their pay, exploring opportunities in long-term care and considering shifts during weekends or holidays can be advantageous strategies, as these positions frequently offer additional premiums or incentives.
More salary data for Cape Coral, FL:
Frequently Asked Questions
How much do licensed practical nurses make in Cape Coral, FL in 2026?
Is Cape Coral, FL a good place to work as a licensed practical nurse?
Can licensed practical nurses make $100K in Cape Coral?
What is the cost-of-living adjusted licensed practical nurse salary in Cape Coral?
How much does a licensed practical nurse make per hour in Cape Coral?
Related Pages
Compare Salaries
Career Resources
Nearby Cities in Florida
Written by Aisha Malik, LPN
Career Analyst
Aisha has 10 years of experience as a licensed practical nurse. She specializes in pediatric nursing. Aisha has worked in various outpatient clinics.
Methodology & Data Source
Salary figures on this page are 2026 projections based on the Bureau of Labor Statistics Occupational Employment and Wage Statistics (OEWS) survey, May 2026 release. The BLS reported a median annual salary of $61,530 for licensed practical nursesin the Cape Coral metropolitan area. A 5.70% compound annual growth rate (CAGR), calculated from 6-year national BLS wage trends, was applied to project current 2026 compensation. Percentile ranges (P10–P90) represent the full salary distribution across experience levels and practice settings in this market.
Data Sources & Methodology
Source: BLS, OEWS, 7-year dataset (–). Per-city data from annual BLS metropolitan area surveys.
2026 figures are projected from 2025 BLS data using a compound annual growth rate (CAGR) of 5.70%, derived from historical BLS wage trends for licensed practical nurses (SOC 29-2061).
Compiled and verified by Aisha Malik, LPN, a licensed licensed practical nurse with 10+ years of clinical experience. · View source data at BLS.gov