Licensed Practical Nurse Salary in Muncie, IN: $67,997 (2026)
Quick Answer:A full-time licensed practical nurse in Muncie, IN earns a median $67,997/year (≈ $32.69/hour) in nominal terms for 2026 — projected from BLS OEWS 2025 (SOC 29-2061). Once you factor in Muncie's price level (12% below national, BEA RPP 88.1), that paycheck buys what $77,140 would nationally. Nominal pay sits 0.9% below the Indiana state average.
Official BLS data · View source
In Muncie, Indiana, the compensation for licensed practical nurses (LPNs) reflects the local healthcare dynamics, particularly influenced by the settings in which they work. For 2026, LPNs are projected to earn a median annual salary of $67,997, closely mirroring the national figure of $68,071. Licensing and settings play essential roles in determining pay, with salaries ranging from $52,163 to $77,446 depending on the work environment, which may include skilled nursing facilities, home health care, or clinics. Data derived from official Bureau of Labor Statistics (BLS) OEWS surveys illustrates that while the certified nursing workforce is stable, variations in pay highlight the demand for skilled nursing in a region with shifts in healthcare delivery models.
Salary Breakdown
| Percentile | Annual | Hourly |
|---|---|---|
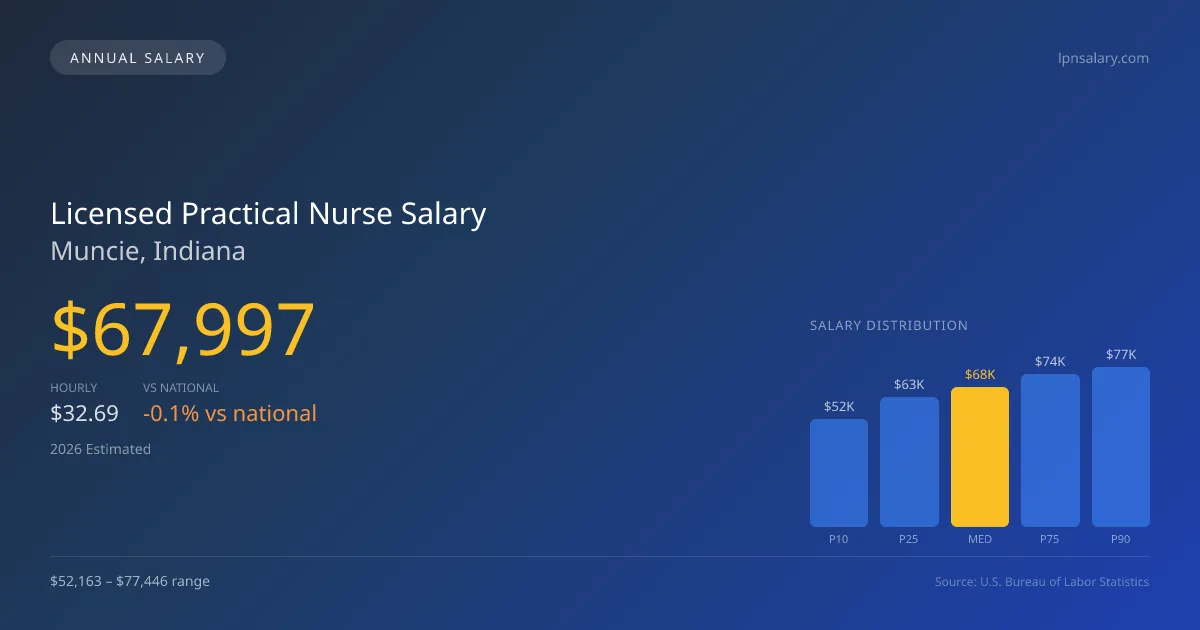
| Entry Level (P10) | $52,163 | $25.07 |
| Lower Range (P25) | $63,124 | $30.35 |
| Median (P50)(typical) | $67,997 | $32.69 |
| Upper Range (P75) | $74,180 | $35.66 |
| Top Earners (P90) | $77,446 | $37.24 |
Median Salary Position
0.11% below the national average
2026 Salary Percentile Distribution in Muncie
In Muncie, IN, the licensed practical nurse salary spread from the 10th to 90th percentile is $25,283 (2026 est.). At $67,997, the local median is 0.11% below the national median of $68,071.
Salary Calculator
At 40 hours/week in Muncie: You'd be above the median
How Muncie Licensed Practical Nurse Pay Compares
Muncie median: $67,997/year (2026)
| Compared To | Median Salary | Muncie Pays |
|---|---|---|
| Indiana Average | $68,614 | -0.90% less |
| National Average | $68,071 | -0.11% less |
Licensed Practical Nurses in Muncie, IN earn a median of $67,997 per year (2026 est.), which is 0.11% lower than the national median of $68,071 and 0.90% below the Indiana state average of $68,614.
Cost-of-Living Adjusted Salary
Muncie has a cost of living 11.85% below the national average, meaning your salary goes further here.
Adjusted salary = nominal × (100 / CoL index). CoL index: 100 = national average.
Muncie, IN has a cost-of-living index of 88.148 (below the national average of 100). A licensed practical nurse earning $67,997 nominally has purchasing power equivalent to $77,140 in an average-cost city — an effective 13.45% boost.
Compare Purchasing Power
Select a city to see how your salary compares after cost of living
Select a city above to compare purchasing power
2019 BLS Actual
$45,520
2025 BLS Actual
$64,330
2026 Current Est.
$67,997
2019–2027 Growth
+57.9%
Salary Trajectory for Licensed Practical Nurses in Muncie (2019–2027)
2019–2025: actual BLS OEWS data for this metro area. 2026+: CAGR 5.70% projection.
| Year | Annual Salary | Status |
|---|---|---|
| 2019 | $45,520 | Actual |
| 2020 | $45,880 | Actual |
| 2021 | $46,690 | Actual |
| 2022 | $54,080 | Actual |
| 2023 | $58,860 | Actual |
| 2024 | $63,970 | Actual |
| 2025 | $64,330 | Actual |
| 2026(current) | $67,997 | Estimated |
| 2027 | $71,873 | Projected |
Based on 7 years of BLS OEWS data for the Muncie metropolitan area, the median licensed practical nurse salary grew 41.3% from $45,520 (2019) to $64,330 (2025). At a 5.70% compound annual growth rate, salaries are projected to reach $71,873 by 2027 — a total increase of $26,353 (57.89%) from 2019.
Note: Historical values (2019–2025) are actual BLS OEWS figures for the Muncie metropolitan area, sourced from annual Occupational Employment and Wage Statistics surveys. 2026–2026 figures are current estimates, and 2027 values are projections, calculated using a 5.70% CAGR derived from 7-year BLS historical data. Actual salaries may vary based on employer, experience, certifications, and local market conditions.
Salary by Experience Level
| Experience | Estimated Salary Range |
|---|---|
| 0-2 years (New Graduate) | $52,163 – $63,124 |
| 3-5 years (Mid Career) | $63,124 – $67,997 |
| 5+ years (Experienced) | $67,997 – $74,180 |
| 10+ years (Top Earner) | $74,180 – $77,446 |
LPN salary ranges estimated from BLS percentile data. Individual licensed practical nurse compensation varies by employer, certifications, and specialization.
Licensed Practical Nurse Job Market in Muncie
With approximately 300 LPNs employed in Muncie, the job market remains competitive, even as the cost of living index sits below the national average at 88.148. This affordability can enhance purchasing power, making the LPN salary in Muncie more attractive. Skilled nursing facilities tend to offer the highest pay, followed by hospitals; home health agencies, while flexible, often provide lower rates. Disparities in compensation are influenced by factors such as shift differentials, certifications like IV therapy, and additional premiums for weekends and holidays. To maximize earning potential in this local market, LPNs should consider seeking roles in higher-paying environments, pursuing further certifications, and working flexible hours to take advantage of premium pay opportunities.
More salary data for Muncie, IN:
Frequently Asked Questions
How much do licensed practical nurses make in Muncie, IN in 2026?
Is Muncie, IN a good place to work as a licensed practical nurse?
Can licensed practical nurses make $100K in Muncie?
What is the cost-of-living adjusted licensed practical nurse salary in Muncie?
How much does a licensed practical nurse make per hour in Muncie?
Related Pages
Compare Salaries
Career Resources
Nearby Cities in Indiana
Written by Aisha Malik, LPN
Career Analyst
Aisha has 10 years of experience as a licensed practical nurse. She specializes in pediatric nursing. Aisha has worked in various outpatient clinics.
Methodology & Data Source
Salary figures on this page are 2026 projections based on the Bureau of Labor Statistics Occupational Employment and Wage Statistics (OEWS) survey, May 2026 release. The BLS reported a median annual salary of $64,330 for licensed practical nursesin the Muncie metropolitan area. A 5.70% compound annual growth rate (CAGR), calculated from 6-year national BLS wage trends, was applied to project current 2026 compensation. Percentile ranges (P10–P90) represent the full salary distribution across experience levels and practice settings in this market.
Data Sources & Methodology
Source: BLS, OEWS, 7-year dataset (–). Per-city data from annual BLS metropolitan area surveys.
2026 figures are projected from 2025 BLS data using a compound annual growth rate (CAGR) of 5.70%, derived from historical BLS wage trends for licensed practical nurses (SOC 29-2061).
Compiled and verified by Aisha Malik, LPN, a licensed licensed practical nurse with 10+ years of clinical experience. · View source data at BLS.gov