Licensed Practical Nurse Salary in Kansas City, MO: $68,092 (2026)
Quick Answer:A full-time licensed practical nurse in Kansas City, MO earns a median $68,092/year (≈ $32.74/hour) in nominal terms for 2026 — projected from BLS OEWS 2025 (SOC 29-2061). Once you factor in Kansas City's price level (7% below national, BEA RPP 92.5), that paycheck buys what $73,579 would nationally. Nominal pay sits 5.5% above the Missouri state average.
Official BLS data · View source
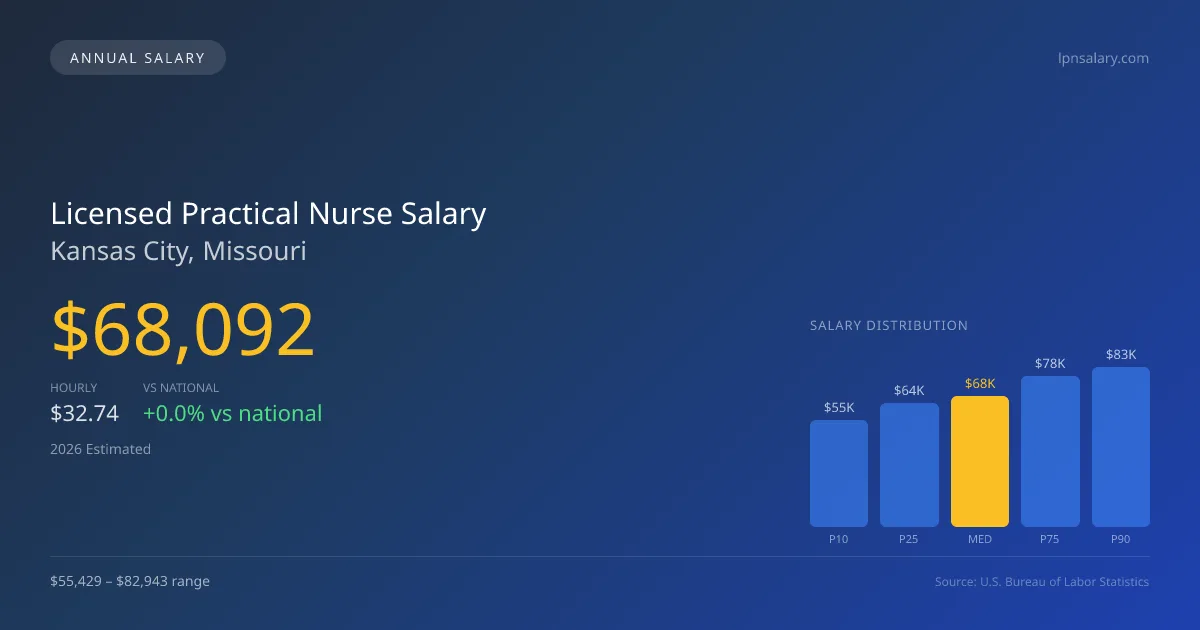
In Kansas City, Missouri, licensed practical nurses are projected to earn a median annual salary of $68,092 in 2026. This figure is slightly above the national median of $68,071, indicating a competitive compensation environment for LPNs in the region. The salary range for this role is extensive, spanning from $55,429 at the 10th percentile to $82,943 at the 90th percentile, reflecting the variation in experience, skills, and employment settings. These insights are drawn from 2025 BLS OEWS data, projected to 2026. With a state scope of practice allowing for IV therapy and assessment, LPNs in Kansas City can enjoy enhanced roles that often lead to better compensation opportunities.
Salary Breakdown
| Percentile | Annual | Hourly |
|---|---|---|
| Entry Level (P10) | $55,429 | $26.65 |
| Lower Range (P25) | $64,065 | $30.80 |
| Median (P50)(typical) | $68,092 | $32.74 |
| Upper Range (P75) | $78,112 | $37.56 |
| Top Earners (P90) | $82,943 | $39.88 |
Median Salary Position
0.03% above the national average
2026 Salary Percentile Distribution in Kansas City
In Kansas City, MO, the licensed practical nurse salary spread from the 10th to 90th percentile is $27,514 (2026 est.). At $68,092, the local median is 0.03% above the national median of $68,071.
Salary Calculator
At 40 hours/week in Kansas City: You'd be in the lower-middle range
How Kansas City Licensed Practical Nurse Pay Compares
Kansas City median: $68,092/year (2026)
| Compared To | Median Salary | Kansas City Pays |
|---|---|---|
| Missouri Average | $64,542 | +5.50% more |
| National Average | $68,071 | +0.03% more |
Licensed Practical Nurses in Kansas City, MO earn a median of $68,092 per year (2026 est.), which is 0.03% higher than the national median of $68,071 and 5.50% above the Missouri state average of $64,542.
Cost-of-Living Adjusted Salary
Kansas City has a cost of living 7.46% below the national average, meaning your salary goes further here.
Adjusted salary = nominal × (100 / CoL index). CoL index: 100 = national average.
Kansas City, MO has a cost-of-living index of 92.543 (below the national average of 100). A licensed practical nurse earning $68,092 nominally has purchasing power equivalent to $73,579 in an average-cost city — an effective 8.06% boost.
Compare Purchasing Power
Select a city to see how your salary compares after cost of living
Select a city above to compare purchasing power
2019 BLS Actual
$46,570
2025 BLS Actual
$64,420
2026 Current Est.
$68,092
2019–2027 Growth
+54.5%
Salary Trajectory for Licensed Practical Nurses in Kansas City (2019–2027)
2019–2025: actual BLS OEWS data for this metro area. 2026+: CAGR 5.70% projection.
| Year | Annual Salary | Status |
|---|---|---|
| 2019 | $46,570 | Actual |
| 2020 | $47,710 | Actual |
| 2021 | $48,200 | Actual |
| 2022 | $53,950 | Actual |
| 2023 | $59,950 | Actual |
| 2024 | $62,700 | Actual |
| 2025 | $64,420 | Actual |
| 2026(current) | $68,092 | Estimated |
| 2027 | $71,973 | Projected |
Based on 7 years of BLS OEWS data for the Kansas City metropolitan area, the median licensed practical nurse salary grew 38.3% from $46,570 (2019) to $64,420 (2025). At a 5.70% compound annual growth rate, salaries are projected to reach $71,973 by 2027 — a total increase of $25,403 (54.55%) from 2019.
Note: Historical values (2019–2025) are actual BLS OEWS figures for the Kansas City metropolitan area, sourced from annual Occupational Employment and Wage Statistics surveys. 2026–2026 figures are current estimates, and 2027 values are projections, calculated using a 5.70% CAGR derived from 7-year BLS historical data. Actual salaries may vary based on employer, experience, certifications, and local market conditions.
Salary by Experience Level
| Experience | Estimated Salary Range |
|---|---|
| 0-2 years (New Graduate) | $55,429 – $64,065 |
| 3-5 years (Mid Career) | $64,065 – $68,092 |
| 5+ years (Experienced) | $68,092 – $78,112 |
| 10+ years (Top Earner) | $78,112 – $82,943 |
LPN salary ranges estimated from BLS percentile data. Individual licensed practical nurse compensation varies by employer, certifications, and specialization.
Licensed Practical Nurse Job Market in Kansas City
Within the local job market, there are currently 4,570 licensed practical nurses employed in Kansas City, MO. The cost of living index in the area stands at 92.543, below the national average, which positively influences purchasing power and can make the salary more favorable for LPNs. Skilled nursing facilities typically offer the highest pay for licensed practical nurses, followed by home health agencies and hospitals. The disparity in earnings can be attributed to various factors, including the setting—skilled nursing generally offers better compensation than physician offices—alongside shift differentials, weekend premiums, and other incentives like charge LPN pay. To maximize earnings, LPNs may consider obtaining IV therapy certifications and seeking work in higher-paying settings or taking on additional shifts that offer premium pay. This approach can significantly enhance licensed practical nurse pay in Kansas City, concrete strategies for boosting overall compensation in this thriving sector.
More salary data for Kansas City, MO:
Frequently Asked Questions
How much do licensed practical nurses make in Kansas City, MO in 2026?
Is Kansas City, MO a good place to work as a licensed practical nurse?
Can licensed practical nurses make $100K in Kansas City?
What is the cost-of-living adjusted licensed practical nurse salary in Kansas City?
How much does a licensed practical nurse make per hour in Kansas City?
Related Pages
Compare Salaries
Career Resources
Nearby Cities in Missouri
Written by Aisha Malik, LPN
Career Analyst
Aisha has 10 years of experience as a licensed practical nurse. She specializes in pediatric nursing. Aisha has worked in various outpatient clinics.
Methodology & Data Source
Salary figures on this page are 2026 projections based on the Bureau of Labor Statistics Occupational Employment and Wage Statistics (OEWS) survey, May 2026 release. The BLS reported a median annual salary of $64,420 for licensed practical nursesin the Kansas City metropolitan area. A 5.70% compound annual growth rate (CAGR), calculated from 6-year national BLS wage trends, was applied to project current 2026 compensation. Percentile ranges (P10–P90) represent the full salary distribution across experience levels and practice settings in this market.
Data Sources & Methodology
Source: BLS, OEWS, 7-year dataset (–). Per-city data from annual BLS metropolitan area surveys.
2026 figures are projected from 2025 BLS data using a compound annual growth rate (CAGR) of 5.70%, derived from historical BLS wage trends for licensed practical nurses (SOC 29-2061).
Compiled and verified by Aisha Malik, LPN, a licensed licensed practical nurse with 10+ years of clinical experience. · View source data at BLS.gov