Licensed Practical Nurse Salary in Bend, OR: $88,006 (2026)
Quick Answer:A full-time licensed practical nurse in Bend, OR earns a median $88,006/year (≈ $42.31/hour) in nominal terms for 2026 — projected from BLS OEWS 2025 (SOC 29-2061). Once you factor in Bend's price level (4% above national, BEA RPP 103.6), that paycheck buys what $84,942 would nationally. Nominal pay sits 4.6% above the Oregon state average.
Official BLS data · View source
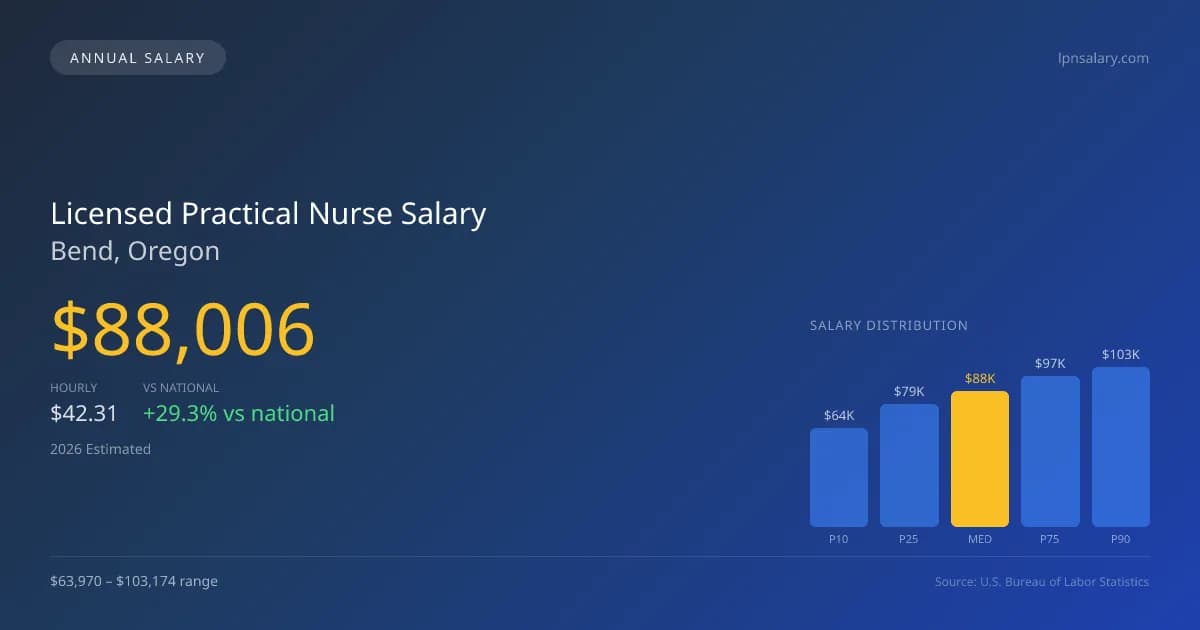
In 2026, licensed practical nurses (LPNs) in Bend, Oregon, can anticipate a median annual salary of $88,006, a figure that significantly surpasses the national median of $68,071. The projected salary range for LPNs in the area varies from $63,970 at the 10th percentile to $103,174 at the 90th percentile, indicating a diverse earning potential depending on experience and job setting. This data, derived from the official Bureau of Labor Statistics (BLS) Occupational Employment and Wage Statistics (OEWS) surveys, reflects the state’s robust scope-of-practice regulations, including advanced responsibilities like IV therapy and patient assessment, which can lead to higher compensation. The job market for LPNs in Bend is expected to remain strong, especially as healthcare continues to evolve, placing demand on skilled nursing professionals.
Salary Breakdown
| Percentile | Annual | Hourly |
|---|---|---|
| Entry Level (P10) | $63,970 | $30.75 |
| Lower Range (P25) | $79,074 | $38.01 |
| Median (P50)(typical) | $88,006 | $42.31 |
| Upper Range (P75) | $97,212 | $46.74 |
| Top Earners (P90) | $103,174 | $49.61 |
Median Salary Position
29.29% above the national average
2026 Salary Percentile Distribution in Bend
In Bend, OR, the licensed practical nurse salary spread from the 10th to 90th percentile is $39,204 (2026 est.). At $88,006, the local median is 29.29% above the national median of $68,071.
Salary Calculator
At 40 hours/week in Bend: You'd be above the median
How Bend Licensed Practical Nurse Pay Compares
Bend median: $88,006/year (2026)
| Compared To | Median Salary | Bend Pays |
|---|---|---|
| Oregon Average | $84,136 | +4.60% more |
| National Average | $68,071 | +29.29% more |
Licensed Practical Nurses in Bend, OR earn a median of $88,006 per year (2026 est.), which is 29.29% higher than the national median of $68,071 and 4.60% above the Oregon state average of $84,136.
Cost-of-Living Adjusted Salary
Bend has a cost of living 3.61% above the national average.
Adjusted salary = nominal × (100 / CoL index). CoL index: 100 = national average.
Bend, OR has a cost-of-living index of 103.607 (above the national average of 100). While the nominal salary of $88,006 is competitive, the higher cost of living reduces purchasing power to an effective $84,942 — a 3.48% reduction.
Compare Purchasing Power
Select a city to see how your salary compares after cost of living
Select a city above to compare purchasing power
2019 BLS Actual
$52,430
2025 BLS Actual
$83,260
2026 Current Est.
$88,006
2019–2027 Growth
+77.4%
Salary Trajectory for Licensed Practical Nurses in Bend (2019–2027)
2019–2025: actual BLS OEWS data for this metro area. 2026+: CAGR 5.70% projection.
| Year | Annual Salary | Status |
|---|---|---|
| 2019 | $52,430 | Actual |
| 2020 | $55,100 | Actual |
| 2021 | $59,070 | Actual |
| 2022 | $61,780 | Actual |
| 2023 | $62,350 | Actual |
| 2024 | $79,040 | Actual |
| 2025 | $83,260 | Actual |
| 2026(current) | $88,006 | Estimated |
| 2027 | $93,022 | Projected |
Based on 7 years of BLS OEWS data for the Bend metropolitan area, the median licensed practical nurse salary grew 58.8% from $52,430 (2019) to $83,260 (2025). At a 5.70% compound annual growth rate, salaries are projected to reach $93,022 by 2027 — a total increase of $40,592 (77.42%) from 2019.
Note: Historical values (2019–2025) are actual BLS OEWS figures for the Bend metropolitan area, sourced from annual Occupational Employment and Wage Statistics surveys. 2026–2026 figures are current estimates, and 2027 values are projections, calculated using a 5.70% CAGR derived from 7-year BLS historical data. Actual salaries may vary based on employer, experience, certifications, and local market conditions.
Salary by Experience Level
| Experience | Estimated Salary Range |
|---|---|
| 0-2 years (New Graduate) | $63,970 – $79,074 |
| 3-5 years (Mid Career) | $79,074 – $88,006 |
| 5+ years (Experienced) | $88,006 – $97,212 |
| 10+ years (Top Earner) | $97,212 – $103,174 |
LPN salary ranges estimated from BLS percentile data. Individual licensed practical nurse compensation varies by employer, certifications, and specialization.
Licensed Practical Nurse Job Market in Bend
Currently, Bend employs around 150 licensed practical nurses, highlighting a competitive local job market. However, the cost-of-living index stands at 103.607, nudging above the national average and affecting disposable income for health professionals. Among various healthcare settings in Bend, skilled nursing facilities tend to offer the most competitive pay, while home health agencies and physician offices generally provide lower salaries. The fluctuation in licensed practical nurse pay in Bend, OR, can be attributed to factors such as the setting type, shift differentials, and the availability of IV therapy certification stipends, all of which can elevate earnings. LPNs looking to maximize their income in this thriving market should consider pursuing certifications and seeking employment in high-paying environments like long-term care facilities, where additional premiums for weekend and holiday shifts can further enhance annual earnings.
More salary data for Bend, OR:
Frequently Asked Questions
How much do licensed practical nurses make in Bend, OR in 2026?
Is Bend, OR a good place to work as a licensed practical nurse?
Can licensed practical nurses make $100K in Bend?
What is the cost-of-living adjusted licensed practical nurse salary in Bend?
How much does a licensed practical nurse make per hour in Bend?
Related Pages
Compare Salaries
Career Resources
Nearby Cities in Oregon
Written by Aisha Malik, LPN
Career Analyst
Aisha has 10 years of experience as a licensed practical nurse. She specializes in pediatric nursing. Aisha has worked in various outpatient clinics.
Methodology & Data Source
Salary figures on this page are 2026 projections based on the Bureau of Labor Statistics Occupational Employment and Wage Statistics (OEWS) survey, May 2026 release. The BLS reported a median annual salary of $83,260 for licensed practical nursesin the Bend metropolitan area. A 5.70% compound annual growth rate (CAGR), calculated from 6-year national BLS wage trends, was applied to project current 2026 compensation. Percentile ranges (P10–P90) represent the full salary distribution across experience levels and practice settings in this market.
Data Sources & Methodology
Source: BLS, OEWS, 7-year dataset (–). Per-city data from annual BLS metropolitan area surveys.
2026 figures are projected from 2025 BLS data using a compound annual growth rate (CAGR) of 5.70%, derived from historical BLS wage trends for licensed practical nurses (SOC 29-2061).
Compiled and verified by Aisha Malik, LPN, a licensed licensed practical nurse with 10+ years of clinical experience. · View source data at BLS.gov