Licensed Practical Nurse Salary in California: $86,049 (2026)
Quick Answer:Across California's 158 metropolitan areas, the average median licensed practical nurse pay sits at $86,049/year heading into 2026 — a figure projected from 2025 BLS OEWS wage data for SOC 29-2061. Because California sits at BEA RPP 113.1 (13% above the U.S. baseline), that statewide median translates to roughly $76,082 in nationally-comparable purchasing power. Highest-paying metros: Sunnyvale ($97,558), Santa Clara ($96,918), Oakland ($96,456).
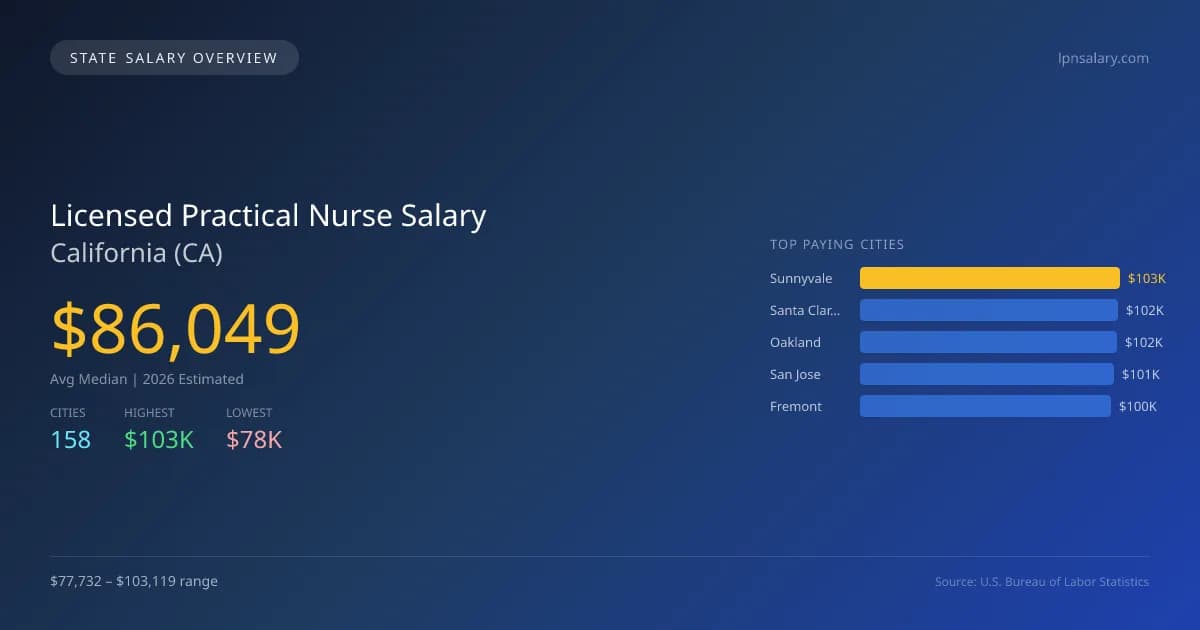
In 2026, the average median salary for licensed practical nurses in California is projected to be $86,049, which is significantly higher than the national median of $68,071, representing a difference of 26.4%. The highest-paying city, Sunnyvale, offers salaries around $103,119, while Visalia, the lowest-paying city, has salaries at $77,732. This $25,387 salary gap is influenced by various factors, including the cost of living, demand for healthcare services, and local economic conditions. California’s licensing requirements and scope of practice laws contribute to the competitive pay for LPNs. The state demands rigorous educational standards that help maintain a highly trained workforce. As healthcare needs continue to rise, particularly in urban areas, the job market for LPNs remains strong, with a projected growth rate of 5.70% annually. The top five cities for LPN salaries reflect this trend, with Santa Clara at $102,442, Oakland at $101,954, San Jose at $100,753, and Fremont at $99,706. The increasing demand for skilled nursing care enhances job stability in this field, making it a viable option for those considering a career in healthcare.
California Licensed Practical Nurse Salary Range
Overall salary range in California: $57,252 (lowest entry-level) to $139,635 (highest top earner)
California vs National Average
California licensed practical nurses earn 26.41% more than the national median (+$17,978/year difference).
California Licensed Practical Nurse Salary Distribution (2026)
Licensed Practical Nurse salaries in California range from $69,542 (entry-level, 10th percentile) to $104,723 (top earners, 90th percentile), with a median of $86,049. The California median is $17,978 above the US national median of $68,071. The average hourly rate is $41.37/hr. Approximately 82,999 licensed practical nurses are employed across 158 cities.
2019 BLS Actual
$59,235
2025 BLS Actual
$81,409
2026 Current Est.
$86,049
2019–2027 Growth
+53.5%
Salary Trajectory for Licensed Practical Nurses in California (2019–2027)
2019–2025: actual BLS OEWS data for this metro area. 2026+: CAGR 5.70% projection.
| Year | Annual Salary | Status |
|---|---|---|
| 2019 | $59,235 | Actual |
| 2020 | $62,912 | Actual |
| 2021 | $63,033 | Actual |
| 2022 | $66,978 | Actual |
| 2023 | $75,818 | Actual |
| 2024 | $78,924 | Actual |
| 2025 | $81,409 | Actual |
| 2026(current) | $86,049 | Estimated |
| 2027 | $90,954 | Projected |
Based on 7 years of BLS OEWS data for the California metropolitan area, the median licensed practical nurse salary grew 37.4% from $59,235 (2019) to $81,409 (2025). At a 5.70% compound annual growth rate, salaries are projected to reach $90,954 by 2027 — a total increase of $31,719 (53.55%) from 2019.
Note: Historical values (2019–2025) are actual BLS OEWS figures for the California metropolitan area, sourced from annual Occupational Employment and Wage Statistics surveys. 2026–2026 figures are current estimates, and 2027 values are projections, calculated using a 5.70% CAGR derived from 7-year BLS historical data. Actual salaries may vary based on employer, experience, certifications, and local market conditions.
Top 5 Highest Paying Cities in California
Lowest Paying Cities in California
Best Value Cities for Licensed Practical Nurses in California
When adjusted for local cost of living, these California cities offer the most purchasing power for licensed practical nurses.
| City | Nominal Salary | CoL Index | Adjusted Salary |
|---|---|---|---|
| San Jose | $100,753 | 110.423 | $91,243 |
| Sunnyvale | $103,119 | 113.1 | $91,175 |
| Santa Rosa | $97,857 | 107.784 | $90,790 |
| Santa Clara | $102,442 | 113.1 | $90,576 |
| Oakland | $101,954 | 113.1 | $90,145 |
Adjusted salary = nominal salary × (100 / CoL index). CoL index: 100 = national average. Lower index = lower cost of living.
Salary by Experience Level in California
| Experience Level | Estimated Annual |
|---|---|
| Entry Level (0-2 years) | $69,542 |
| Mid Career (3-7 years) | $86,049 |
| Experienced (7+ years) | $104,723 |
Estimates based on BLS percentile data averaged across California metro areas. Individual pay varies by employer, certifications, and specialization.
All 158 Cities in California
| # | City | Median Salary |
|---|---|---|
| 1 | Sunnyvale | $103,119 |
| 2 | Santa Clara | $102,442 |
| 3 | Oakland | $101,954 |
| 4 | San Jose | $100,753 |
| 5 | Fremont | $99,706 |
| 6 | San Francisco | $99,686 |
| 7 | Santa Rosa | $97,857 |
| 8 | Petaluma | $96,922 |
| 9 | Vallejo | $90,300 |
| 10 | Santa Ana | $88,486 |
| 11 | Napa | $88,460 |
| 12 | Fontana | $86,848 |
| 13 | Folsom | $86,802 |
| 14 | Irvine | $86,752 |
| 15 | Pomona | $86,329 |
| 16 | Simi Valley | $86,282 |
| 17 | Escondido | $86,262 |
| 18 | Sacramento | $86,219 |
| 19 | Fairfield | $86,106 |
| 20 | Roseville | $85,864 |
| 21 | Fullerton | $85,789 |
| 22 | Daly City | $85,715 |
| 23 | El Monte | $85,688 |
| 24 | Vista | $85,641 |
| 25 | Concord | $85,620 |
| 26 | Santa Cruz | $85,617 |
| 27 | Salinas | $85,522 |
| 28 | Clovis | $85,492 |
| 29 | Garden Grove | $85,405 |
| 30 | Temecula | $85,384 |
| 31 | Santa Clarita | $85,327 |
| 32 | Anaheim | $85,323 |
| 33 | Lancaster | $85,215 |
| 34 | Inglewood | $85,215 |
| 35 | Corona | $85,108 |
| 36 | Richmond | $85,095 |
| 37 | Rialto | $85,054 |
| 38 | Torrance | $84,946 |
| 39 | Elk Grove | $84,784 |
| 40 | Oceanside | $84,764 |
| 41 | Whittier | $84,739 |
| 42 | San Rafael | $84,732 |
| 43 | Rancho Cucamonga | $84,656 |
| 44 | Hayward | $84,609 |
| 45 | Woodland | $84,586 |
| 46 | Buena Park | $84,574 |
| 47 | Encinitas | $84,566 |
| 48 | Downey | $84,561 |
| 49 | Dublin | $84,513 |
| 50 | San Luis Obispo | $84,497 |
| 51 | Redlands | $84,487 |
| 52 | Chino | $84,442 |
| 53 | Westminster | $84,415 |
| 54 | Santa Monica | $84,408 |
| 55 | San Mateo | $84,399 |
| 56 | Tulare | $84,375 |
| 57 | Chula Vista | $84,361 |
| 58 | San Buenaventura | $84,345 |
| 59 | Mission Viejo | $84,289 |
| 60 | Moreno Valley | $84,288 |
| 61 | Pleasanton | $84,276 |
| 62 | San Diego | $84,264 |
| 63 | Pasadena | $84,156 |
| 64 | Long Beach | $84,109 |
| 65 | Santee | $84,097 |
| 66 | Glendale | $84,021 |
| 67 | Mountain View | $83,979 |
| 68 | Pittsburg | $83,971 |
| 69 | Novato | $83,945 |
| 70 | Costa Mesa | $83,913 |
| 71 | Los Angeles | $83,831 |
| 72 | Berkeley | $83,825 |
| 73 | Huntington Beach | $83,805 |
| 74 | Jurupa Valley | $83,731 |
| 75 | Hemet | $83,707 |
| 76 | Union City | $83,701 |
| 77 | West Covina | $83,691 |
| 78 | Chino Hills | $83,667 |
| 79 | Carlsbad | $83,560 |
| 80 | Gilroy | $83,548 |
| 81 | Oxnard | $83,524 |
| 82 | Santa Maria | $83,514 |
| 83 | San Marcos | $83,502 |
| 84 | Tustin | $83,429 |
| 85 | San Ramon | $83,423 |
| 86 | Eastvale | $83,343 |
| 87 | Murrieta | $83,340 |
| 88 | Vacaville | $83,340 |
| 89 | Brentwood | $83,303 |
| 90 | Hesperia | $83,264 |
| 91 | Lake Elsinore | $83,257 |
| 92 | Chico | $83,239 |
| 93 | Thousand Oaks | $83,187 |
| 94 | Citrus Heights | $83,151 |
| 95 | El Cajon | $83,077 |
| 96 | San Clemente | $83,052 |
| 97 | Bellflower | $83,019 |
| 98 | Palmdale | $82,982 |
| 99 | La Mirada | $82,982 |
| 100 | Apple Valley | $82,966 |
| 101 | Menifee | $82,942 |
| 102 | Yucaipa | $82,907 |
| 103 | Norwalk | $82,902 |
| 104 | Rancho Cordova | $82,828 |
| 105 | Montebello | $82,748 |
| 106 | Yuba City | $82,721 |
| 107 | Compton | $82,714 |
| 108 | Modesto | $82,657 |
| 109 | Porterville | $82,655 |
| 110 | Lompoc | $82,645 |
| 111 | Hawthorne | $82,517 |
| 112 | Antioch | $82,489 |
| 113 | Burbank | $82,483 |
| 114 | Ontario | $82,454 |
| 115 | Alhambra | $82,292 |
| 116 | Livermore | $82,292 |
| 117 | Orange | $82,267 |
| 118 | Stockton | $82,266 |
| 119 | South Gate | $82,265 |
| 120 | Victorville | $82,246 |
| 121 | West Sacramento | $82,219 |
| 122 | Poway | $82,198 |
| 123 | San Leandro | $82,087 |
| 124 | Hanford | $82,076 |
| 125 | Indio | $81,994 |
| 126 | Lake Forest | $81,994 |
| 127 | Carson | $81,849 |
| 128 | Rocklin | $81,835 |
| 129 | Newport Beach | $81,697 |
| 130 | Redwood City | $81,689 |
| 131 | Turlock | $81,670 |
| 132 | Manteca | $81,644 |
| 133 | Perris | $81,636 |
| 134 | Madera | $81,571 |
| 135 | San Bernardino | $81,458 |
| 136 | Baldwin Park | $81,425 |
| 137 | Palo Alto | $81,425 |
| 138 | Lakewood | $81,392 |
| 139 | Riverside | $81,357 |
| 140 | Beaumont | $81,154 |
| 141 | Tracy | $81,134 |
| 142 | Lodi | $81,131 |
| 143 | Alameda | $81,108 |
| 144 | Laguna Niguel | $81,088 |
| 145 | Milpitas | $81,048 |
| 146 | Camarillo | $80,876 |
| 147 | Oakley | $80,843 |
| 148 | Davis | $80,824 |
| 149 | Upland | $80,763 |
| 150 | La Habra | $80,645 |
| 151 | Lynwood | $80,611 |
| 152 | Bakersfield | $80,469 |
| 153 | Merced | $80,216 |
| 154 | Fresno | $79,888 |
| 155 | Brea | $79,236 |
| 156 | El Centro | $78,968 |
| 157 | Redding | $78,366 |
| 158 | Visalia | $77,732 |
More California Salary Data
Hourly Rates
Explore licensed practical nurse hourly pay in California cities.
Senior / Experienced
Top earner salaries for experienced licensed practical nurses.
Compare Cities in California
View all comparisons →Explore More Licensed Practical Nurse Salary Data
Frequently Asked Questions
How much do licensed practical nurses make in California in 2026?
What is the highest paying city for licensed practical nurses in California?
How does California licensed practical nurse pay compare to the national average?
What is the entry-level licensed practical nurse salary in California?
How many licensed practical nurses are employed in California?
Which California city offers the best value for licensed practical nurses?
Written by Aisha Malik, LPN
Career Analyst
Aisha has 10 years of experience as a licensed practical nurse. She specializes in pediatric nursing. Aisha has worked in various outpatient clinics.
Methodology & Data Source
Statewide salary figures on this page are 2026 projections based on the Bureau of Labor Statistics Occupational Employment and Wage Statistics (OEWS) survey, May 2026 release. A 5.70% compound annual growth rate (CAGR), derived from 6-year national BLS wage trends, was applied to each metro area's reported salary to estimate current 2026 licensed practical nurse compensation across California. State averages are employment-weighted across 158 metro areas — larger metro areas with more licensed practical nursescontribute proportionally more to the average, producing figures that better reflect typical compensation. Individual pay varies by city, employer, certifications, and experience.
Data Sources & Methodology
Source: BLS, OEWS, 7-year dataset (–). Per-city data from annual BLS metropolitan area surveys.
2026 figures are projected from 2025 BLS data using a compound annual growth rate (CAGR) of 5.70%, derived from historical BLS wage trends for licensed practical nurses (SOC 29-2061).
Compiled and verified by Aisha Malik, LPN, a licensed licensed practical nurse with 10+ years of clinical experience. · View source data at BLS.gov