Licensed Practical Nurse Salary in Yuba City, CA: $82,721 (2026)
Quick Answer:A full-time licensed practical nurse in Yuba City, CA earns a median $82,721/year (≈ $39.77/hour) in nominal terms for 2026 — projected from BLS OEWS 2025 (SOC 29-2061). Once you factor in Yuba City's price level (4% above national, BEA RPP 104.2), that paycheck buys what $79,362 would nationally. Nominal pay sits 0.9% below the California state average.
Official BLS data · View source
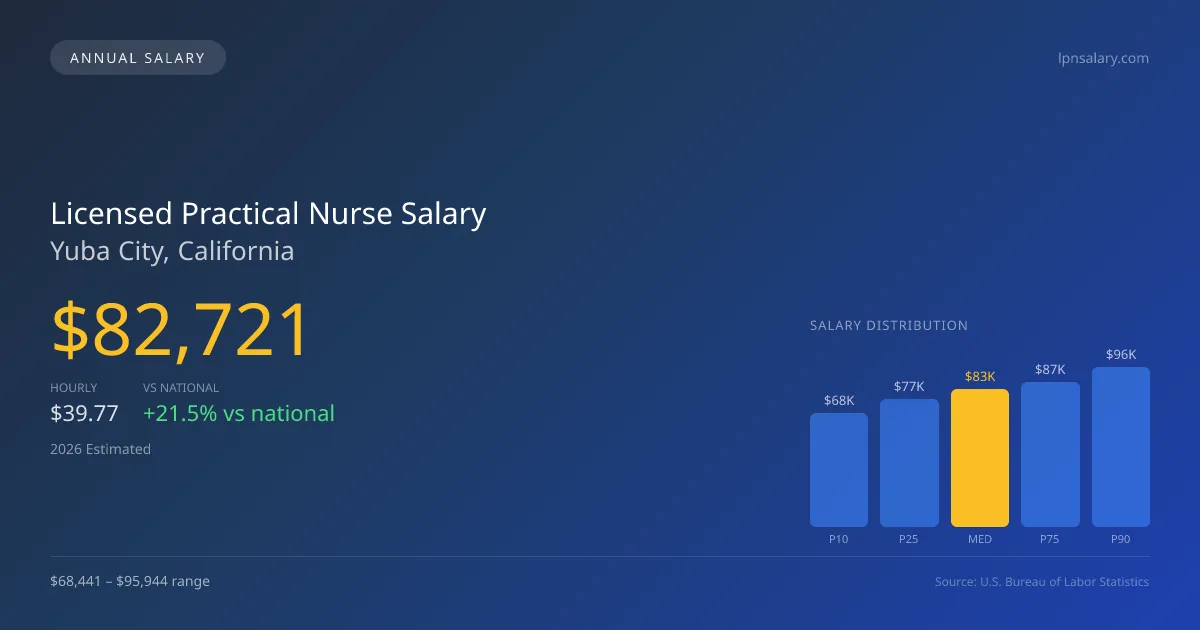
In Yuba City, licensed practical nurses can expect a median annual salary of $82,721 in 2026, which is significantly higher than the national median of $68,071 for the same year. The salary range for LPNs in this California city spans from $68,441 at the 10th percentile to $95,944 at the 90th percentile, reflecting the diverse employment settings available. This data, derived from 2025 BLS OEWS surveys, highlights the competitive nature of the healthcare market in Yuba City, influenced by the structural choices between skilled nursing facilities, home health agencies, and clinics. Given the region's growing demand for quality care, LPNs can find rewarding opportunities across various environments, with the potential for pay progression based on experience and specialized skills.
Salary Breakdown
| Percentile | Annual | Hourly |
|---|---|---|
| Entry Level (P10) | $68,441 | $32.90 |
| Lower Range (P25) | $76,791 | $36.92 |
| Median (P50)(typical) | $82,721 | $39.77 |
| Upper Range (P75) | $87,129 | $41.89 |
| Top Earners (P90) | $95,944 | $46.13 |
Median Salary Position
21.52% above the national average
2026 Salary Percentile Distribution in Yuba City
In Yuba City, CA, the licensed practical nurse salary spread from the 10th to 90th percentile is $27,503 (2026 est.). At $82,721, the local median is 21.52% above the national median of $68,071.
Salary Calculator
At 40 hours/week in Yuba City: You'd be above the median
How Yuba City Licensed Practical Nurse Pay Compares
Yuba City median: $82,721/year (2026)
| Compared To | Median Salary | Yuba City Pays |
|---|---|---|
| California Average | $83,472 | -0.90% less |
| National Average | $68,071 | +21.52% more |
Licensed Practical Nurses in Yuba City, CA earn a median of $82,721 per year (2026 est.), which is 21.52% higher than the national median of $68,071 and 0.90% below the California state average of $83,472.
Cost-of-Living Adjusted Salary
Yuba City has a cost of living 4.23% above the national average.
Adjusted salary = nominal × (100 / CoL index). CoL index: 100 = national average.
Yuba City, CA has a cost-of-living index of 104.233 (above the national average of 100). While the nominal salary of $82,721 is competitive, the higher cost of living reduces purchasing power to an effective $79,362 — a 4.06% reduction.
Compare Purchasing Power
Select a city to see how your salary compares after cost of living
Select a city above to compare purchasing power
2019 BLS Actual
$58,880
2025 BLS Actual
$78,260
2026 Current Est.
$82,721
2019–2027 Growth
+48.5%
Salary Trajectory for Licensed Practical Nurses in Yuba City (2019–2027)
2019–2025: actual BLS OEWS data for this metro area. 2026+: CAGR 5.70% projection.
| Year | Annual Salary | Status |
|---|---|---|
| 2019 | $58,880 | Actual |
| 2020 | $61,570 | Actual |
| 2021 | $61,060 | Actual |
| 2022 | $64,510 | Actual |
| 2023 | $67,350 | Actual |
| 2024 | $76,030 | Actual |
| 2025 | $78,260 | Actual |
| 2026(current) | $82,721 | Estimated |
| 2027 | $87,436 | Projected |
Based on 7 years of BLS OEWS data for the Yuba City metropolitan area, the median licensed practical nurse salary grew 32.9% from $58,880 (2019) to $78,260 (2025). At a 5.70% compound annual growth rate, salaries are projected to reach $87,436 by 2027 — a total increase of $28,556 (48.50%) from 2019.
Note: Historical values (2019–2025) are actual BLS OEWS figures for the Yuba City metropolitan area, sourced from annual Occupational Employment and Wage Statistics surveys. 2026–2026 figures are current estimates, and 2027 values are projections, calculated using a 5.70% CAGR derived from 7-year BLS historical data. Actual salaries may vary based on employer, experience, certifications, and local market conditions.
Salary by Experience Level
| Experience | Estimated Salary Range |
|---|---|
| 0-2 years (New Graduate) | $68,441 – $76,791 |
| 3-5 years (Mid Career) | $76,791 – $82,721 |
| 5+ years (Experienced) | $82,721 – $87,129 |
| 10+ years (Top Earner) | $87,129 – $95,944 |
LPN salary ranges estimated from BLS percentile data. Individual licensed practical nurse compensation varies by employer, certifications, and specialization.
Licensed Practical Nurse Job Market in Yuba City
The local job market demonstrates robust opportunities for licensed practical nurses, with approximately 330 LPNs currently employed in Yuba City. However, the cost of living index of 104.233 indicates that residents face higher-than-average expenses, which can affect take-home purchasing power. Skilled nursing facilities typically offer higher wages compared to other employers like home health agencies and physician offices, primarily due to the complex care needs of patients in long-term settings. Factors contributing to the pay disparity include shift differentials, premiums for weekend and holiday shifts, and additional stipends for specialized skills like IV therapy. To maximize earning potential, LPNs in Yuba City should seek positions in long-term care and pursue certifications that enhance their skills and marketability, while considering opportunities for advancement through LPN-to-RN bridge programs that open doors to higher-paying roles.
More salary data for Yuba City, CA:
Frequently Asked Questions
How much do licensed practical nurses make in Yuba City, CA in 2026?
Is Yuba City, CA a good place to work as a licensed practical nurse?
Can licensed practical nurses make $100K in Yuba City?
What is the cost-of-living adjusted licensed practical nurse salary in Yuba City?
How much does a licensed practical nurse make per hour in Yuba City?
Related Pages
Compare Salaries
Career Resources
Nearby Cities in California
Written by Aisha Malik, LPN
Career Analyst
Aisha has 10 years of experience as a licensed practical nurse. She specializes in pediatric nursing. Aisha has worked in various outpatient clinics.
Methodology & Data Source
Salary figures on this page are 2026 projections based on the Bureau of Labor Statistics Occupational Employment and Wage Statistics (OEWS) survey, May 2026 release. The BLS reported a median annual salary of $78,260 for licensed practical nursesin the Yuba City metropolitan area. A 5.70% compound annual growth rate (CAGR), calculated from 6-year national BLS wage trends, was applied to project current 2026 compensation. Percentile ranges (P10–P90) represent the full salary distribution across experience levels and practice settings in this market.
Data Sources & Methodology
Source: BLS, OEWS, 7-year dataset (–). Per-city data from annual BLS metropolitan area surveys.
2026 figures are projected from 2025 BLS data using a compound annual growth rate (CAGR) of 5.70%, derived from historical BLS wage trends for licensed practical nurses (SOC 29-2061).
Compiled and verified by Aisha Malik, LPN, a licensed licensed practical nurse with 10+ years of clinical experience. · View source data at BLS.gov