Licensed Practical Nurse Salary in Cape Girardeau, MO: $63,526 (2026)
Quick Answer:A full-time licensed practical nurse in Cape Girardeau, MO earns a median $63,526/year (≈ $30.55/hour) in nominal terms for 2026 — projected from BLS OEWS 2025 (SOC 29-2061). Once you factor in Cape Girardeau's price level (14% below national, BEA RPP 86.1), that paycheck buys what $73,801 would nationally. Nominal pay sits 1.5% below the Missouri state average.
Official BLS data · View source
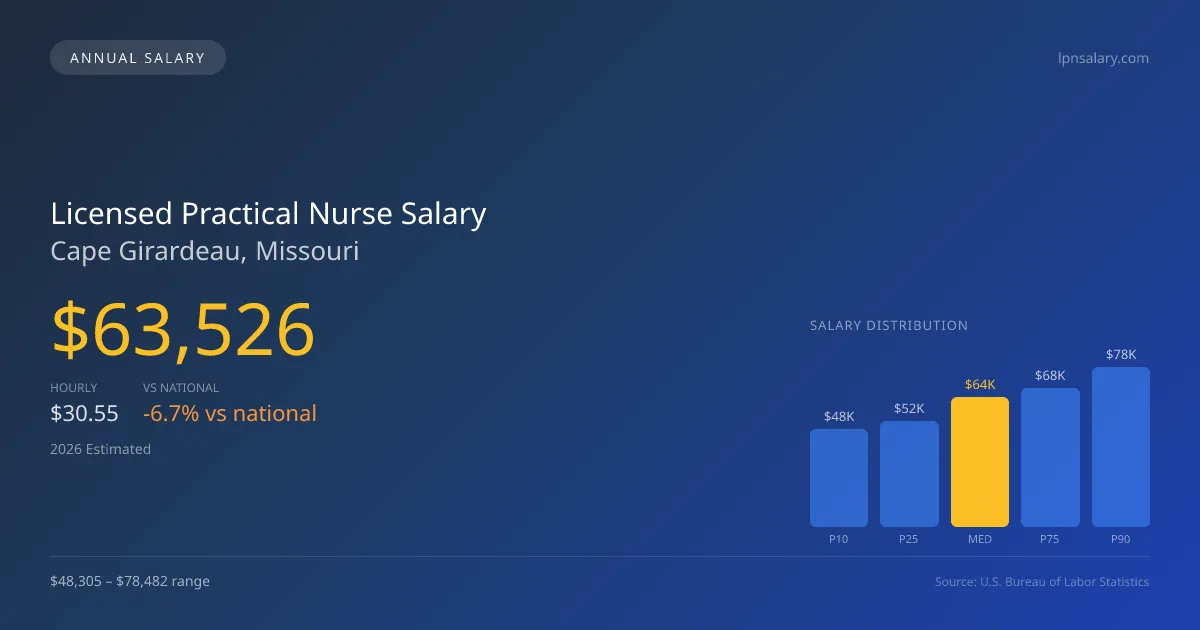
In Cape Girardeau, Missouri, the licensed practical nurse salary is projected to reach a median of $63,526 in 2026, falling below the national median of $68,071. This salary range spans from $48,305 at the 10th percentile to $78,482 at the 90th percentile, reflecting the variety of settings where LPNs practice. Often, shift differentials and weekend premiums are significant factors in this compensation, particularly within long-term care facilities, which predominantly employ LPNs. The numbers provided are based on 2025 BLS OEWS data, projected to 2026, revealing a robust job market for 410 licensed practical nurses in the area.
Salary Breakdown
| Percentile | Annual | Hourly |
|---|---|---|
| Entry Level (P10) | $48,305 | $23.22 |
| Lower Range (P25) | $52,237 | $25.11 |
| Median (P50)(typical) | $63,526 | $30.55 |
| Upper Range (P75) | $68,092 | $32.74 |
| Top Earners (P90) | $78,482 | $37.73 |
Median Salary Position
6.68% below the national average
2026 Salary Percentile Distribution in Cape Girardeau
In Cape Girardeau, MO, the licensed practical nurse salary spread from the 10th to 90th percentile is $30,177 (2026 est.). At $63,526, the local median is 6.68% below the national median of $68,071.
Salary Calculator
At 40 hours/week in Cape Girardeau: You'd be above the median
How Cape Girardeau Licensed Practical Nurse Pay Compares
Cape Girardeau median: $63,526/year (2026)
| Compared To | Median Salary | Cape Girardeau Pays |
|---|---|---|
| Missouri Average | $64,493 | -1.50% less |
| National Average | $68,071 | -6.68% less |
Licensed Practical Nurses in Cape Girardeau, MO earn a median of $63,526 per year (2026 est.), which is 6.68% lower than the national median of $68,071 and 1.50% below the Missouri state average of $64,493.
Cost-of-Living Adjusted Salary
Cape Girardeau has a cost of living 13.92% below the national average, meaning your salary goes further here.
Adjusted salary = nominal × (100 / CoL index). CoL index: 100 = national average.
Cape Girardeau, MO has a cost-of-living index of 86.078 (below the national average of 100). A licensed practical nurse earning $63,526 nominally has purchasing power equivalent to $73,801 in an average-cost city — an effective 16.17% boost.
Compare Purchasing Power
Select a city to see how your salary compares after cost of living
Select a city above to compare purchasing power
2019 BLS Actual
$41,640
2025 BLS Actual
$60,100
2026 Current Est.
$63,526
2019–2027 Growth
+61.3%
Salary Trajectory for Licensed Practical Nurses in Cape Girardeau (2019–2027)
2019–2025: actual BLS OEWS data for this metro area. 2026+: CAGR 5.70% projection.
| Year | Annual Salary | Status |
|---|---|---|
| 2019 | $41,640 | Actual |
| 2020 | $37,240 | Actual |
| 2021 | $43,390 | Actual |
| 2022 | $45,390 | Actual |
| 2023 | $54,920 | Actual |
| 2024 | $57,840 | Actual |
| 2025 | $60,100 | Actual |
| 2026(current) | $63,526 | Estimated |
| 2027 | $67,147 | Projected |
Based on 7 years of BLS OEWS data for the Cape Girardeau metropolitan area, the median licensed practical nurse salary grew 44.3% from $41,640 (2019) to $60,100 (2025). At a 5.70% compound annual growth rate, salaries are projected to reach $67,147 by 2027 — a total increase of $25,507 (61.26%) from 2019.
Note: Historical values (2019–2025) are actual BLS OEWS figures for the Cape Girardeau metropolitan area, sourced from annual Occupational Employment and Wage Statistics surveys. 2026–2026 figures are current estimates, and 2027 values are projections, calculated using a 5.70% CAGR derived from 7-year BLS historical data. Actual salaries may vary based on employer, experience, certifications, and local market conditions.
Salary by Experience Level
| Experience | Estimated Salary Range |
|---|---|
| 0-2 years (New Graduate) | $48,305 – $52,237 |
| 3-5 years (Mid Career) | $52,237 – $63,526 |
| 5+ years (Experienced) | $63,526 – $68,092 |
| 10+ years (Top Earner) | $68,092 – $78,482 |
LPN salary ranges estimated from BLS percentile data. Individual licensed practical nurse compensation varies by employer, certifications, and specialization.
Licensed Practical Nurse Job Market in Cape Girardeau
The economic landscape of Cape Girardeau highlights a cost of living index of 86.078, indicating that while salaries may be lower than national averages, purchasing power remains reasonable. Long-term care settings typically offer higher compensation compared to home health agencies and physician offices, primarily due to the demands of the role and additional premiums for weekends and holidays. To enhance earning potential, LPNs in Cape Girardeau should consider obtaining IV therapy certifications and pursuing charge nurse roles that command higher pay. With a growth rate of 5.70% anticipated over the next five years, those entering the field can expect gradual salary increases, further solidifying practical nursing as a viable career path in the region.
More salary data for Cape Girardeau, MO:
Frequently Asked Questions
How much do licensed practical nurses make in Cape Girardeau, MO in 2026?
Is Cape Girardeau, MO a good place to work as a licensed practical nurse?
Can licensed practical nurses make $100K in Cape Girardeau?
What is the cost-of-living adjusted licensed practical nurse salary in Cape Girardeau?
How much does a licensed practical nurse make per hour in Cape Girardeau?
Related Pages
Compare Salaries
Career Resources
Nearby Cities in Missouri
Written by Aisha Malik, LPN
Career Analyst
Aisha has 10 years of experience as a licensed practical nurse. She specializes in pediatric nursing. Aisha has worked in various outpatient clinics.
Methodology & Data Source
Salary figures on this page are 2026 projections based on the Bureau of Labor Statistics Occupational Employment and Wage Statistics (OEWS) survey, May 2026 release. The BLS reported a median annual salary of $60,100 for licensed practical nursesin the Cape Girardeau metropolitan area. A 5.70% compound annual growth rate (CAGR), calculated from 6-year national BLS wage trends, was applied to project current 2026 compensation. Percentile ranges (P10–P90) represent the full salary distribution across experience levels and practice settings in this market.
Data Sources & Methodology
Source: BLS, OEWS, 7-year dataset (–). Per-city data from annual BLS metropolitan area surveys.
2026 figures are projected from 2025 BLS data using a compound annual growth rate (CAGR) of 5.70%, derived from historical BLS wage trends for licensed practical nurses (SOC 29-2061).
Compiled and verified by Aisha Malik, LPN, a licensed licensed practical nurse with 10+ years of clinical experience. · View source data at BLS.gov