Licensed Practical Nurse Salary in Richland, WA: $85,922 (2026)
Quick Answer:A full-time licensed practical nurse in Richland, WA earns a median $85,922/year (≈ $41.31/hour) in nominal terms for 2026 — projected from BLS OEWS 2025 (SOC 29-2061). Once you factor in Richland's price level (7% above national, BEA RPP 107.4), that paycheck buys what $80,002 would nationally. Nominal pay sits 3.0% above the Washington state average.
Based on BLS state-level estimates · View source
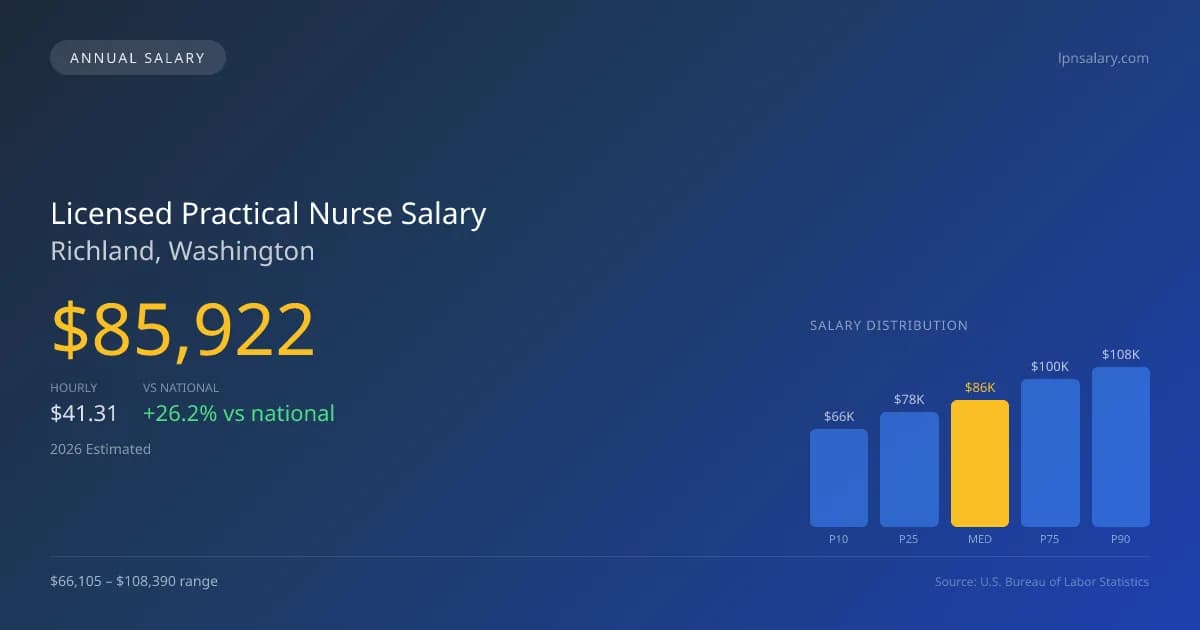
In 2026, licensed practical nurses in Richland, Washington, are projected to earn a median annual salary of $85,922, which exceeds the national median of $68,071 by over 26%. The salary range for this occupation in the area spans from $66,105 at the 10th percentile to $108,390 at the 90th percentile, reflecting local market dynamics and the increased demand for skilled nursing. Richland's LPNs benefit from the state's robust scope-of-practice rules, including the authority to perform IV therapy and assessments, which enhances their skill set and contributes positively to compensation. Given the steady growth in employment opportunities, the job market for LPNs remains competitive and offers pathways for advancement through additional certifications and specialized training.
About the Richland Market
Salary estimated from Washington average ($72,000) adjusted for local cost of living.
Salary Breakdown
| Percentile | Annual | Hourly |
|---|---|---|
| Entry Level (P10) | $66,105 | $31.78 |
| Lower Range (P25) | $77,881 | $37.44 |
| Median (P50)(typical) | $85,922 | $41.31 |
| Upper Range (P75) | $100,322 | $48.23 |
| Top Earners (P90) | $108,390 | $52.11 |
Median Salary Position
26.22% above the national average
2026 Salary Percentile Distribution in Richland
In Richland, WA, the licensed practical nurse salary spread from the 10th to 90th percentile is $42,285 (2026 est.). At $85,922, the local median is 26.22% above the national median of $68,071.
Salary Calculator
At 40 hours/week in Richland: You'd be in the lower-middle range
How Richland Licensed Practical Nurse Pay Compares
Richland median: $85,922/year (2026)
| Compared To | Median Salary | Richland Pays |
|---|---|---|
| Washington Average | $83,420 | +3.00% more |
| National Average | $68,071 | +26.22% more |
Licensed Practical Nurses in Richland, WA earn a median of $85,922 per year (2026 est.), which is 26.22% higher than the national median of $68,071 and 3.00% above the Washington state average of $83,420.
Cost-of-Living Adjusted Salary
Richland has a cost of living 7.40% above the national average.
Adjusted salary = nominal × (100 / CoL index). CoL index: 100 = national average.
Richland, WA has a cost-of-living index of 107.4 (above the national average of 100). While the nominal salary of $85,922 is competitive, the higher cost of living reduces purchasing power to an effective $80,002 — a 6.89% reduction.
Compare Purchasing Power
Select a city to see how your salary compares after cost of living
Select a city above to compare purchasing power
2019 BLS Actual
$59,932
2025 BLS Actual
$81,289
2026 Current Est.
$85,922
2019–2027 Growth
+51.5%
Salary Trajectory for Licensed Practical Nurses in Richland (2019–2027)
2019–2025: actual BLS OEWS data for this metro area. 2026+: CAGR 5.70% projection.
| Year | Annual Salary | Status |
|---|---|---|
| 2019 | $59,932 | Actual |
| 2020 | $61,623 | Actual |
| 2021 | $60,676 | Actual |
| 2022 | $68,944 | Actual |
| 2023 | $75,394 | Actual |
| 2024 | $78,150 | Actual |
| 2025 | $81,289 | Actual |
| 2026(current) | $85,922 | Estimated |
| 2027 | $90,820 | Projected |
Based on 7 years of BLS OEWS data for the Richland metropolitan area, the median licensed practical nurse salary grew 35.6% from $59,932 (2019) to $81,289 (2025). At a 5.70% compound annual growth rate, salaries are projected to reach $90,820 by 2027 — a total increase of $30,888 (51.54%) from 2019.
Note: Historical values (2019–2025) are actual BLS OEWS figures for the Richland metropolitan area, sourced from annual Occupational Employment and Wage Statistics surveys. 2026–2026 figures are current estimates, and 2027 values are projections, calculated using a 5.70% CAGR derived from 7-year BLS historical data. Actual salaries may vary based on employer, experience, certifications, and local market conditions.
Salary by Experience Level
| Experience | Estimated Salary Range |
|---|---|
| 0-2 years (New Graduate) | $66,105 – $77,881 |
| 3-5 years (Mid Career) | $77,881 – $85,922 |
| 5+ years (Experienced) | $85,922 – $100,322 |
| 10+ years (Top Earner) | $100,322 – $108,390 |
LPN salary ranges estimated from BLS percentile data. Individual licensed practical nurse compensation varies by employer, certifications, and specialization.
Licensed Practical Nurse Job Market in Richland
The local job market features about 15 licensed practical nurses, indicating a fairly tight labor pool. Richland's cost of living index stands at 107.4, meaning expenses are slightly above the national average, which could impact take-home earnings. Among the various employers in the area, skilled nursing facilities typically offer the highest compensation, followed closely by hospitals and long-term care settings, where LPNs can secure weekend or holiday premiums and extra pay for specific certifications like IV therapy. Pay disparities in the region can be influenced by factors such as workplace setting and shift differentials. To maximize earnings, LPNs may consider seeking employment in skilled nursing or hospice care and pursuing additional certifications or flexible shift options that often translate to higher pay in Richland, WA.
More salary data for Richland, WA:
Frequently Asked Questions
How much do licensed practical nurses make in Richland, WA in 2026?
Is Richland, WA a good place to work as a licensed practical nurse?
Can licensed practical nurses make $100K in Richland?
What is the cost-of-living adjusted licensed practical nurse salary in Richland?
How much does a licensed practical nurse make per hour in Richland?
Related Pages
Compare Salaries
Career Resources
Nearby Cities in Washington
Written by Aisha Malik, LPN
Career Analyst
Aisha has 10 years of experience as a licensed practical nurse. She specializes in pediatric nursing. Aisha has worked in various outpatient clinics.
Methodology & Data Source
Salary figures on this page are 2026 projections based on the Bureau of Labor Statistics Occupational Employment and Wage Statistics (OEWS) survey, May 2026 release. The BLS reported a median annual salary of $81,289 for licensed practical nursesin the Richland metropolitan area. A 5.70% compound annual growth rate (CAGR), calculated from 6-year national BLS wage trends, was applied to project current 2026 compensation. Percentile ranges (P10–P90) represent the full salary distribution across experience levels and practice settings in this market.
Data Sources & Methodology
Salary data for Richland is estimated from official BLS state-level occupational wage data (2025), adjusted for regional cost-of-living differences using BEA RPP (Regional Price Parities).
2026 figures are projected from 2025 BLS data using a compound annual growth rate (CAGR) of 5.70%, derived from historical BLS wage trends for licensed practical nurses (SOC 29-2061).
Compiled and verified by Aisha Malik, LPN, a licensed licensed practical nurse with 10+ years of clinical experience. · View source data at BLS.gov