Licensed Practical Nurse Salary in Washington: $87,635 (2026)
Quick Answer:Across Washington's 50 metropolitan areas, the average median licensed practical nurse pay sits at $87,635/year heading into 2026 — a figure projected from 2025 BLS OEWS wage data for SOC 29-2061. Because Washington sits at BEA RPP 107.4 (7% above the U.S. baseline), that statewide median translates to roughly $81,597 in nationally-comparable purchasing power. Highest-paying metros: Bellevue ($86,530), Seattle ($85,690), Tacoma ($84,261).
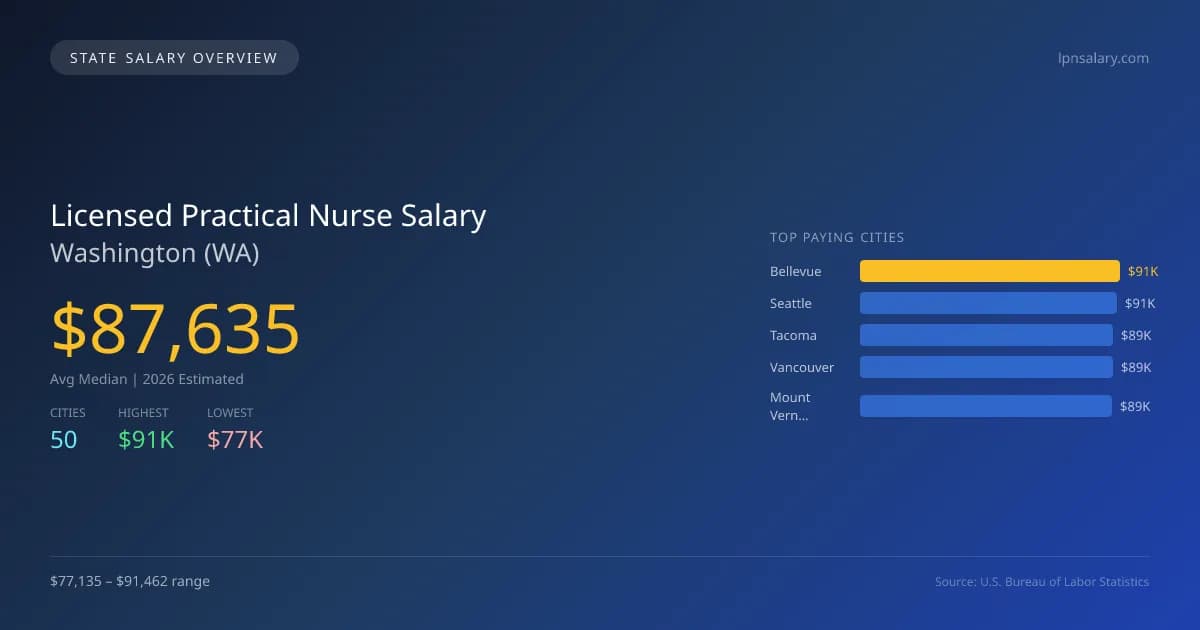
In 2026, licensed practical nurses (LPNs) in Washington are projected to earn an average median salary of $87,635, significantly higher than the national median of $68,071, marking a difference of +28.7%. The salary range within the state varies, with the highest paying city being Bellevue at $91,462, while Tukwila presents the lowest at $77,135, creating a notable salary gap of $14,327. This difference can be attributed to factors such as the cost of living, demand for healthcare services, and available practice settings in urban areas compared to smaller cities. Washington's nursing market is shaped by specific licensing requirements and scope of practice laws, which enhance the role of LPNs in patient care. The significant demand for LPNs in metropolitan areas is driven by a growing aging population and an increasing emphasis on healthcare services, resulting in a projected annual growth rate of 5.70%. With a total of 6,284 licensed practical nurses working across the state, cities like Seattle ($90,574), Tacoma ($89,064), Vancouver ($88,839), and Mount Vernon ($88,725) reflect strong compensation levels that align with the overall state trend, indicating a solid job market outlook for aspiring LPNs in Washington.
Washington Licensed Practical Nurse Salary Range
Overall salary range in Washington: $60,421 (lowest entry-level) to $125,194 (highest top earner)
Washington vs National Average
Washington licensed practical nurses earn 28.74% more than the national median (+$19,564/year difference).
Washington Licensed Practical Nurse Salary Distribution (2026)
Licensed Practical Nurse salaries in Washington range from $70,615 (entry-level, 10th percentile) to $106,804 (top earners, 90th percentile), with a median of $87,635. The Washington median is $19,564 above the US national median of $68,071. The average hourly rate is $42.13/hr. Approximately 6,284 licensed practical nurses are employed across 50 cities.
2019 BLS Actual
$58,139
2025 BLS Actual
$82,909
2026 Current Est.
$87,635
2019–2027 Growth
+59.3%
Salary Trajectory for Licensed Practical Nurses in Washington (2019–2027)
2019–2025: actual BLS OEWS data for this metro area. 2026+: CAGR 5.70% projection.
| Year | Annual Salary | Status |
|---|---|---|
| 2019 | $58,139 | Actual |
| 2020 | $59,912 | Actual |
| 2021 | $61,931 | Actual |
| 2022 | $70,032 | Actual |
| 2023 | $75,871 | Actual |
| 2024 | $78,895 | Actual |
| 2025 | $82,909 | Actual |
| 2026(current) | $87,635 | Estimated |
| 2027 | $92,630 | Projected |
Based on 7 years of BLS OEWS data for the Washington metropolitan area, the median licensed practical nurse salary grew 42.6% from $58,139 (2019) to $82,909 (2025). At a 5.70% compound annual growth rate, salaries are projected to reach $92,630 by 2027 — a total increase of $34,491 (59.33%) from 2019.
Note: Historical values (2019–2025) are actual BLS OEWS figures for the Washington metropolitan area, sourced from annual Occupational Employment and Wage Statistics surveys. 2026–2026 figures are current estimates, and 2027 values are projections, calculated using a 5.70% CAGR derived from 7-year BLS historical data. Actual salaries may vary based on employer, experience, certifications, and local market conditions.
Top 5 Highest Paying Cities in Washington
Lowest Paying Cities in Washington
| City | Median Salary |
|---|---|
| Tukwila | $77,135 |
| Mountlake Terrace | $77,254 |
| Covington | $78,340 |
| Kenmore | $78,346 |
| Oak Harbor | $78,854 |
Best Value Cities for Licensed Practical Nurses in Washington
When adjusted for local cost of living, these Washington cities offer the most purchasing power for licensed practical nurses.
| City | Nominal Salary | CoL Index | Adjusted Salary |
|---|---|---|---|
| Mount Vernon | $88,725 | 102.443 | $86,609 |
| Bellevue | $91,462 | 107.4 | $85,160 |
| Longview | $82,383 | 97.545 | $84,456 |
| Walla Walla | $83,175 | 98.519 | $84,425 |
| Yakima | $80,639 | 95.545 | $84,399 |
Adjusted salary = nominal salary × (100 / CoL index). CoL index: 100 = national average. Lower index = lower cost of living.
Salary by Experience Level in Washington
| Experience Level | Estimated Annual |
|---|---|
| Entry Level (0-2 years) | $70,615 |
| Mid Career (3-7 years) | $87,635 |
| Experienced (7+ years) | $106,804 |
Estimates based on BLS percentile data averaged across Washington metro areas. Individual pay varies by employer, certifications, and specialization.
All 50 Cities in Washington
| # | City | Median Salary |
|---|---|---|
| 1 | Bellevue | $91,462 |
| 2 | Seattle | $90,574 |
| 3 | Tacoma | $89,064 |
| 4 | Vancouver | $88,839 |
| 5 | Mount Vernon | $88,725 |
| 6 | Tumwater | $86,774 |
| 7 | Bremerton | $86,230 |
| 8 | Olympia | $85,987 |
| 9 | Richland | $85,922 |
| 10 | Renton | $85,630 |
| 11 | Lacey | $85,282 |
| 12 | Spokane Valley | $85,056 |
| 13 | Everett | $84,801 |
| 14 | Kennewick | $84,169 |
| 15 | Marysville | $84,166 |
| 16 | Shoreline | $83,703 |
| 17 | Spokane | $83,450 |
| 18 | Redmond | $83,372 |
| 19 | Kent | $83,303 |
| 20 | Bellingham | $83,228 |
| 21 | Walla Walla | $83,175 |
| 22 | Kirkland | $83,168 |
| 23 | Burien | $83,062 |
| 24 | Federal Way | $82,697 |
| 25 | Des Moines | $82,679 |
| 26 | Auburn | $82,487 |
| 27 | Lakewood | $82,453 |
| 28 | Issaquah | $82,407 |
| 29 | Longview | $82,383 |
| 30 | Sammamish | $81,866 |
| 31 | University Place | $81,837 |
| 32 | SeaTac | $81,773 |
| 33 | Pasco | $81,423 |
| 34 | Edmonds | $80,924 |
| 35 | Lake Stevens | $80,710 |
| 36 | Lynnwood | $80,659 |
| 37 | Yakima | $80,639 |
| 38 | Moses Lake | $80,503 |
| 39 | Bothell | $80,445 |
| 40 | Pullman | $80,089 |
| 41 | Puyallup | $79,907 |
| 42 | Wenatchee | $79,867 |
| 43 | Ellensburg | $79,607 |
| 44 | Maple Valley | $79,389 |
| 45 | Camas | $79,188 |
| 46 | Oak Harbor | $78,854 |
| 47 | Kenmore | $78,346 |
| 48 | Covington | $78,340 |
| 49 | Mountlake Terrace | $77,254 |
| 50 | Tukwila | $77,135 |
More Washington Salary Data
Hourly Rates
Explore licensed practical nurse hourly pay in Washington cities.
Senior / Experienced
Top earner salaries for experienced licensed practical nurses.
Explore More Licensed Practical Nurse Salary Data
Frequently Asked Questions
How much do licensed practical nurses make in Washington in 2026?
What is the highest paying city for licensed practical nurses in Washington?
How does Washington licensed practical nurse pay compare to the national average?
What is the entry-level licensed practical nurse salary in Washington?
How many licensed practical nurses are employed in Washington?
Which Washington city offers the best value for licensed practical nurses?
Written by Aisha Malik, LPN
Career Analyst
Aisha has 10 years of experience as a licensed practical nurse. She specializes in pediatric nursing. Aisha has worked in various outpatient clinics.
Methodology & Data Source
Statewide salary figures on this page are 2026 projections based on the Bureau of Labor Statistics Occupational Employment and Wage Statistics (OEWS) survey, May 2026 release. A 5.70% compound annual growth rate (CAGR), derived from 6-year national BLS wage trends, was applied to each metro area's reported salary to estimate current 2026 licensed practical nurse compensation across Washington. State averages are employment-weighted across 50 metro areas — larger metro areas with more licensed practical nursescontribute proportionally more to the average, producing figures that better reflect typical compensation. Individual pay varies by city, employer, certifications, and experience.
Data Sources & Methodology
Source: BLS, OEWS, 7-year dataset (–). Per-city data from annual BLS metropolitan area surveys.
2026 figures are projected from 2025 BLS data using a compound annual growth rate (CAGR) of 5.70%, derived from historical BLS wage trends for licensed practical nurses (SOC 29-2061).
Compiled and verified by Aisha Malik, LPN, a licensed licensed practical nurse with 10+ years of clinical experience. · View source data at BLS.gov