Licensed Practical Nurse Salary in Walla Walla, WA: $83,175 (2026)
Quick Answer:A full-time licensed practical nurse in Walla Walla, WA earns a median $83,175/year (≈ $39.99/hour) in nominal terms for 2026 — projected from BLS OEWS 2025 (SOC 29-2061). Once you factor in Walla Walla's price level (1% below national, BEA RPP 98.5), that paycheck buys what $84,425 would nationally. Nominal pay sits 0.3% below the Washington state average.
Official BLS data · View source
In Walla Walla, Washington, licensed practical nurses are expected to earn a median annual salary of $83,175 in 2026, significantly above the national average of $68,071. The salary range for these professionals varies widely, with entry-level positions starting at around $67,595 and experienced nurses earning up to $97,413. This data, drawn from 2025 BLS OEWS surveys and projected to 2026, reflects a local job market where demand for skilled nursing care and home health services is on the rise. As Walla Walla continues to grow, those looking to enter the field can find ample opportunities in various healthcare settings, whether in skilled nursing facilities, clinics, or home health agencies.
Salary Breakdown
| Percentile | Annual | Hourly |
|---|---|---|
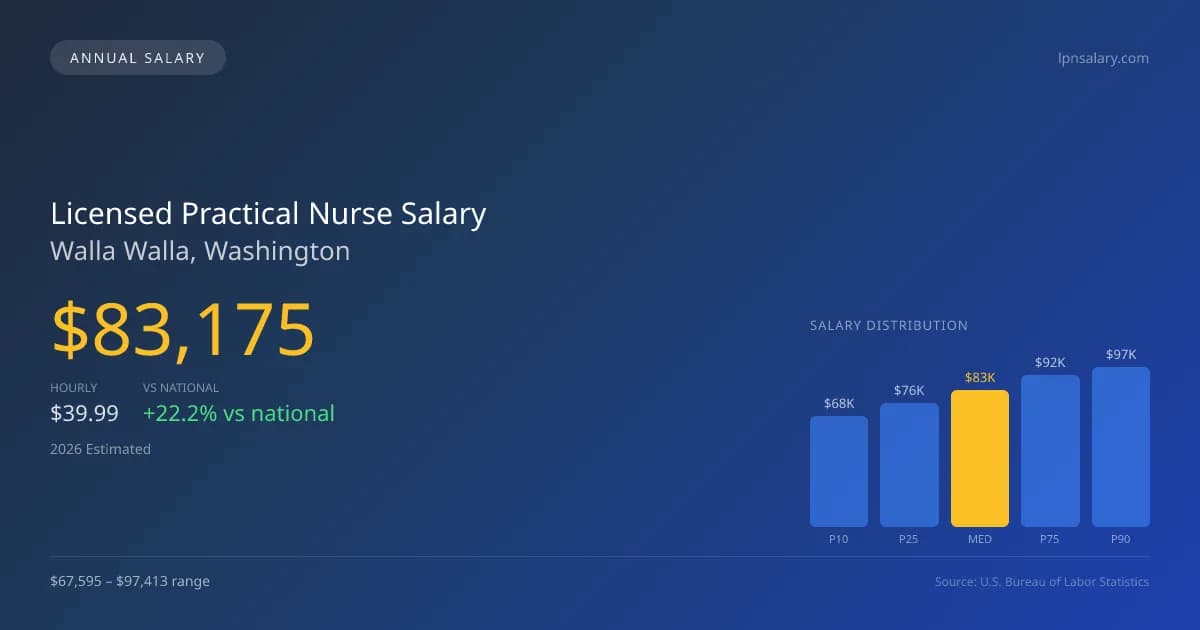
| Entry Level (P10) | $67,595 | $32.50 |
| Lower Range (P25) | $75,649 | $36.37 |
| Median (P50)(typical) | $83,175 | $39.99 |
| Upper Range (P75) | $92,361 | $44.40 |
| Top Earners (P90) | $97,413 | $46.84 |
Median Salary Position
22.19% above the national average
2026 Salary Percentile Distribution in Walla Walla
In Walla Walla, WA, the licensed practical nurse salary spread from the 10th to 90th percentile is $29,818 (2026 est.). At $83,175, the local median is 22.19% above the national median of $68,071.
Salary Calculator
At 40 hours/week in Walla Walla: You'd be above the median
How Walla Walla Licensed Practical Nurse Pay Compares
Walla Walla median: $83,175/year (2026)
| Compared To | Median Salary | Walla Walla Pays |
|---|---|---|
| Washington Average | $83,426 | -0.30% less |
| National Average | $68,071 | +22.19% more |
Licensed Practical Nurses in Walla Walla, WA earn a median of $83,175 per year (2026 est.), which is 22.19% higher than the national median of $68,071 and 0.30% below the Washington state average of $83,426.
Cost-of-Living Adjusted Salary
Walla Walla has a cost of living 1.48% below the national average, meaning your salary goes further here.
Adjusted salary = nominal × (100 / CoL index). CoL index: 100 = national average.
Walla Walla, WA has a cost-of-living index of 98.519 (below the national average of 100). A licensed practical nurse earning $83,175 nominally has purchasing power equivalent to $84,425 in an average-cost city — an effective 1.5% boost.
Compare Purchasing Power
Select a city to see how your salary compares after cost of living
Select a city above to compare purchasing power
2019 BLS Actual
$57,490
2025 BLS Actual
$78,690
2026 Current Est.
$83,175
2019–2027 Growth
+52.9%
Salary Trajectory for Licensed Practical Nurses in Walla Walla (2019–2027)
2019–2025: actual BLS OEWS data for this metro area. 2026+: CAGR 5.70% projection.
| Year | Annual Salary | Status |
|---|---|---|
| 2019 | $57,490 | Actual |
| 2020 | $59,460 | Actual |
| 2021 | $60,260 | Actual |
| 2022 | $64,410 | Actual |
| 2023 | $70,020 | Actual |
| 2024 | $75,310 | Actual |
| 2025 | $78,690 | Actual |
| 2026(current) | $83,175 | Estimated |
| 2027 | $87,916 | Projected |
Based on 7 years of BLS OEWS data for the Walla Walla metropolitan area, the median licensed practical nurse salary grew 36.9% from $57,490 (2019) to $78,690 (2025). At a 5.70% compound annual growth rate, salaries are projected to reach $87,916 by 2027 — a total increase of $30,426 (52.92%) from 2019.
Note: Historical values (2019–2025) are actual BLS OEWS figures for the Walla Walla metropolitan area, sourced from annual Occupational Employment and Wage Statistics surveys. 2026–2026 figures are current estimates, and 2027 values are projections, calculated using a 5.70% CAGR derived from 7-year BLS historical data. Actual salaries may vary based on employer, experience, certifications, and local market conditions.
Salary by Experience Level
| Experience | Estimated Salary Range |
|---|---|
| 0-2 years (New Graduate) | $67,595 – $75,649 |
| 3-5 years (Mid Career) | $75,649 – $83,175 |
| 5+ years (Experienced) | $83,175 – $92,361 |
| 10+ years (Top Earner) | $92,361 – $97,413 |
LPN salary ranges estimated from BLS percentile data. Individual licensed practical nurse compensation varies by employer, certifications, and specialization.
Licensed Practical Nurse Job Market in Walla Walla
The job market for licensed practical nurses in Walla Walla shows a healthy employment figure, with approximately 60 LPNs currently serving in the area. However, the cost of living index stands at 98.519, suggesting that the overall affordability of the region can enhance the purchasing power of local salaries. Skilled nursing facilities typically offer some of the highest pay in the area, while pay structures can vary significantly across settings. For example, those in long-term care often benefit from shift differentials, IV therapy stipends, and additional pay for weekend and holiday shifts. To maximize earnings, LPNs in Walla Walla should consider pursuing certifications that enhance their skill set, seek roles in higher-paying environments like skilled nursing, and explore LPN-to-RN bridge programs for further career advancement.
More salary data for Walla Walla, WA:
Frequently Asked Questions
How much do licensed practical nurses make in Walla Walla, WA in 2026?
Is Walla Walla, WA a good place to work as a licensed practical nurse?
Can licensed practical nurses make $100K in Walla Walla?
What is the cost-of-living adjusted licensed practical nurse salary in Walla Walla?
How much does a licensed practical nurse make per hour in Walla Walla?
Related Pages
Compare Salaries
Career Resources
Nearby Cities in Washington
Written by Aisha Malik, LPN
Career Analyst
Aisha has 10 years of experience as a licensed practical nurse. She specializes in pediatric nursing. Aisha has worked in various outpatient clinics.
Methodology & Data Source
Salary figures on this page are 2026 projections based on the Bureau of Labor Statistics Occupational Employment and Wage Statistics (OEWS) survey, May 2026 release. The BLS reported a median annual salary of $78,690 for licensed practical nursesin the Walla Walla metropolitan area. A 5.70% compound annual growth rate (CAGR), calculated from 6-year national BLS wage trends, was applied to project current 2026 compensation. Percentile ranges (P10–P90) represent the full salary distribution across experience levels and practice settings in this market.
Data Sources & Methodology
Source: BLS, OEWS, 7-year dataset (–). Per-city data from annual BLS metropolitan area surveys.
2026 figures are projected from 2025 BLS data using a compound annual growth rate (CAGR) of 5.70%, derived from historical BLS wage trends for licensed practical nurses (SOC 29-2061).
Compiled and verified by Aisha Malik, LPN, a licensed licensed practical nurse with 10+ years of clinical experience. · View source data at BLS.gov